
What Is a Good Net Promoter Score? a Guide for SaaS in 2026

Ayush Soni
Founder, Revcover

On this page
- Your NPS Score Is a Starting Line Not a Trophy
- Benchmarks are helpful, but only as orientation
- Use NPS to find leverage
- How Net Promoter Score Is Calculated
- The one question behind the score
- A practical way to read the three groups
- The formula that produces the score
- Good NPS Scores and Benchmarks for 2026
- Universal benchmark ranges
- What counts as good in SaaS
- 2026 Net Promoter Score Benchmarks by Industry
- How to Interpret Your NPS Beyond the Single Number
- Trajectory matters more than a snapshot
- Segment the score by revenue reality
- Common NPS Measurement Pitfalls to Avoid
- Bad timing creates fake confidence
- Survey design mistakes that distort the result
- Gaming the score breaks the system
- From Score to Action How to Improve NPS and Reduce Churn
- Turn comments into operating priorities
- Treat detractors like churn signals
- Build a closed loop with product and retention teams
- Frequently Asked Questions About Net Promoter Score
- Should you survey every customer
- Is NPS enough on its own
- What should you ask after the score question
- Can a low score still be useful
Any NPS above 0 is technically good, and for SaaS, a score in the 40 to 55 range is typically strong. But the number itself matters less than whether it's improving over time and what you do with the feedback to reduce churn and protect revenue.
A lot of advice on what is a good Net Promoter Score pushes people toward a vanity target. Get above 30. Aim for 50. Chase world-class. That sounds neat in a dashboard and useless in an operating review.
For a subscription business, NPS only earns its keep when it helps you answer harder questions. Which customers are becoming risky? Which friction points are creating future cancellations? Which complaints come from your highest-value accounts? If your score goes up and churn doesn't improve, you measured sentiment. You didn't improve the business.
That's the lens worth using. NPS is a signal, not the outcome. Revenue is the outcome.
Your NPS Score Is a Starting Line Not a Trophy
Teams often ask the wrong question first. They ask what is a good net promoter score, then stop at the benchmark as if the benchmark itself creates retention.
It doesn't.
A score can look healthy while serious revenue risk sits underneath it. You can have happy long-tenured customers lifting the average while new accounts struggle through onboarding. You can have strong sentiment in your low-value self-serve segment while your largest contracts are privately frustrated. That's why a single number makes a poor trophy and a useful starting line.
Benchmarks are helpful, but only as orientation
There is a reason benchmark ranges exist. Teams need a quick gut check. If your score is positive, you've cleared the first bar. If it's strong for your category, you know you're not operating in a customer experience crisis.
What doesn't work is managing toward the benchmark alone. Product managers start defending the score instead of interrogating it. Growth teams celebrate sentiment without connecting it to expansion, save rates, or churn. Support teams get told to “raise NPS” without any change to product friction or account handoff.
Practical rule: If an NPS conversation ends with the number alone, nobody has learned anything useful.
Use NPS to find leverage
In a subscription business, the best use of NPS is diagnostic.
- Find recurring friction: Look for repeated complaints in onboarding, billing, support, reliability, or missing features.
- Identify who's at risk: A detractor in a high-value account deserves a different response than a passive on a low-usage trial.
- Separate product issues from service issues: “I can't get value” and “support took too long” need different owners.
- Track whether fixes work: Sentiment should improve after the team changes the underlying experience, not after a better-worded email asks for kinder ratings.
That's the operating mindset. The score gives you a direction. The comments tell you where to work. Revenue tells you whether the work mattered.
How Net Promoter Score Is Calculated
The math behind NPS is easy. The part that trips teams up is what the score hides.
A product manager sees a single number and assumes it reflects broad customer satisfaction. It does not. NPS is a directional loyalty metric built from the extremes of your response set, which is why it can be useful for subscription businesses. It helps you spot sentiment that often shows up later in retention, expansion, and churn.
The one question behind the score
The survey uses one core question:
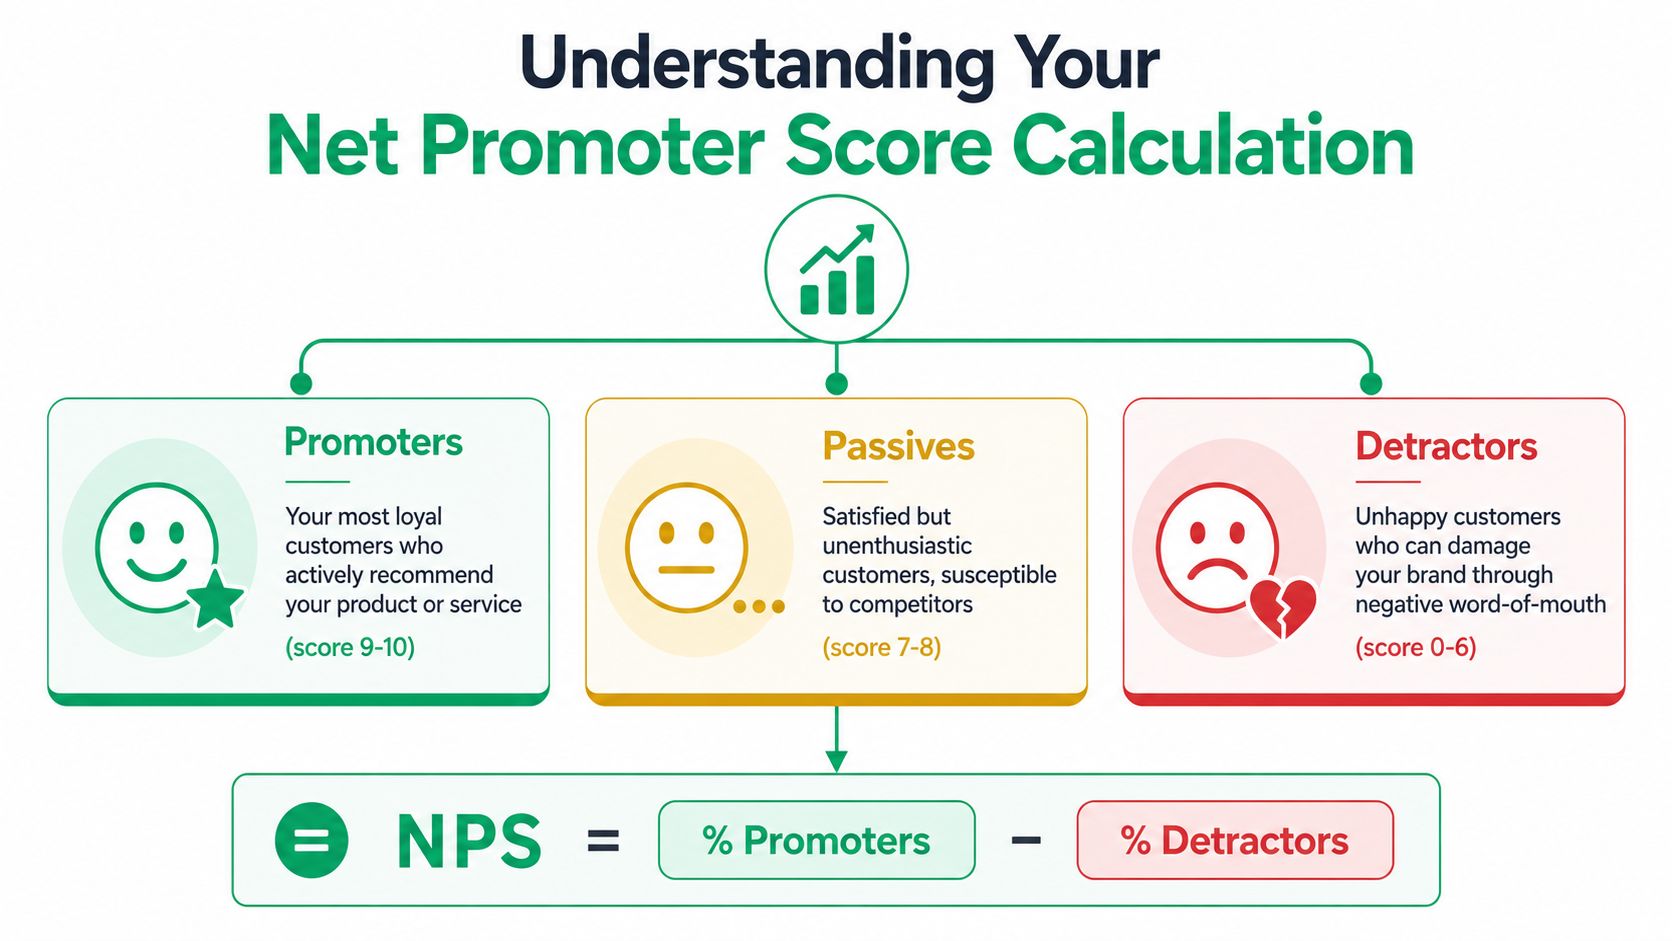
How likely is it that you would recommend our company, product, or service to a friend or colleague?
Customers answer on a 0 to 10 scale. That answer determines which response bucket they fall into. If your team gets this classification wrong, the final score is meaningless.
A practical way to read the three groups
Each response falls into one of three standard categories:
- Promoters: Customers who score you 9 to 10. They are more likely to renew, refer, and give you the benefit of the doubt when something breaks.
- Passives: Customers who score you 7 to 8. They are satisfied enough to stay for now, but they are usually not creating referral momentum or strong expansion pull.
- Detractors: Customers who score you 0 to 6. They are more likely to complain, leave, or require recovery work from support, success, or billing.
This grouping matters because the categories do different jobs in a subscription business. Promoters often correlate with healthier accounts. Detractors often surface friction before it shows up in cancellation data. Passives sit in the middle, which sounds safe, but a large passive base often means your product is acceptable rather than sticky.
If you already track other customer engagement metrics for subscription products, NPS works best alongside them rather than on its own.
The formula that produces the score
The calculation is simple:
NPS = % Promoters - % Detractors
Passives do not affect the score directly.
That detail matters more than the formula itself. You can have a large group of customers who feel fine about your product and still end up with a mediocre NPS because only promoters and detractors change the outcome. NPS works like a net sentiment measure, not an average rating.
Here is the workflow:
- Collect responses on the 0 to 10 scale.
- Sort respondents into Promoters, Passives, and Detractors.
- Calculate each group as a percentage of total responses.
- Subtract the percentage of Detractors from the percentage of Promoters.
A quick example makes this concrete. If 50% of respondents are promoters, 30% are passives, and 20% are detractors, your NPS is 30. The passive group affects the distribution, but not the final subtraction.
If more respondents are detractors than promoters, your NPS goes negative. In practice, that usually means you should stop debating whether the number is "good" and start reading the comments, segmenting the unhappy accounts, and fixing the source of the friction.
If you want a quick visual explainer, this overview is useful:
The arithmetic takes seconds. Getting a score you can trust takes more discipline. You need clean sampling, consistent survey timing, and a follow-up process that routes detractors into the right recovery workflow. Otherwise, NPS becomes a tidy-looking number that never changes revenue outcomes.
Good NPS Scores and Benchmarks for 2026
A "good" NPS is only useful if it changes what your team does next.
Teams get into trouble when they treat benchmarks like a target to hit instead of a reference point. For a subscription business, the number matters less than the behavior underneath it. An NPS of 30 with improving retention can be healthier than an NPS of 50 hiding repeat cancellation reasons, failed onboarding, or billing friction.
Universal benchmark ranges
As noted earlier, broad benchmark ranges are directionally useful. Positive scores mean you have more promoters than detractors. Scores in the 20+ range usually indicate healthy customer sentiment. Scores above 50 are strong. Scores in the 70 to 80 range are rare and usually reflect exceptional fit, execution, or both.
Use those ranges to calibrate expectations, especially when an executive asks for a quick answer.
Do not use them to set product strategy on their own.
What counts as good in SaaS
SaaS needs tighter interpretation because subscription revenue compounds both good and bad customer experiences. A product with a short time to value, low implementation effort, and clear weekly usage patterns can sustain a higher NPS than a product that requires admin setup, team training, procurement approval, and behavior change across an account.
That is why the same score can mean very different things across categories. In practice, many SaaS teams treat the 40 to 55 range as strong. But the more useful question is whether your score is high enough to support expansion, referrals, and lower churn in the segments that drive revenue.
If you want a broader customer health view, pair NPS with engagement metrics for subscription software. That combination gives you a clearer read on whether sentiment is backed by actual product usage and account stickiness.
2026 Net Promoter Score Benchmarks by Industry
| Industry | Average NPS Range |
|---|---|
| B2B sectors | Higher than many consumer categories |
| B2C sectors | Wider variance across subcategories |
| SaaS | Often strong when it reflects retention and expansion health |
The table is a calibration tool. It is not an operating plan.
A benchmark only becomes useful when you connect it to action. If detractors consistently mention poor onboarding, fix activation. If promoters cluster in accounts with high feature adoption, replicate that path. If low scores show up right before failed renewals or involuntary churn, route those responses into recovery workflows quickly. That is where NPS starts affecting revenue instead of sitting in a dashboard.
A "good" score that stays flat while the same churn drivers keep showing up is weaker than a lower score that improves after specific fixes.
That is the benchmark for operators. Use NPS to find what is putting retention at risk, what is worth fixing first, and where a better customer experience can protect recurring revenue.
How to Interpret Your NPS Beyond the Single Number
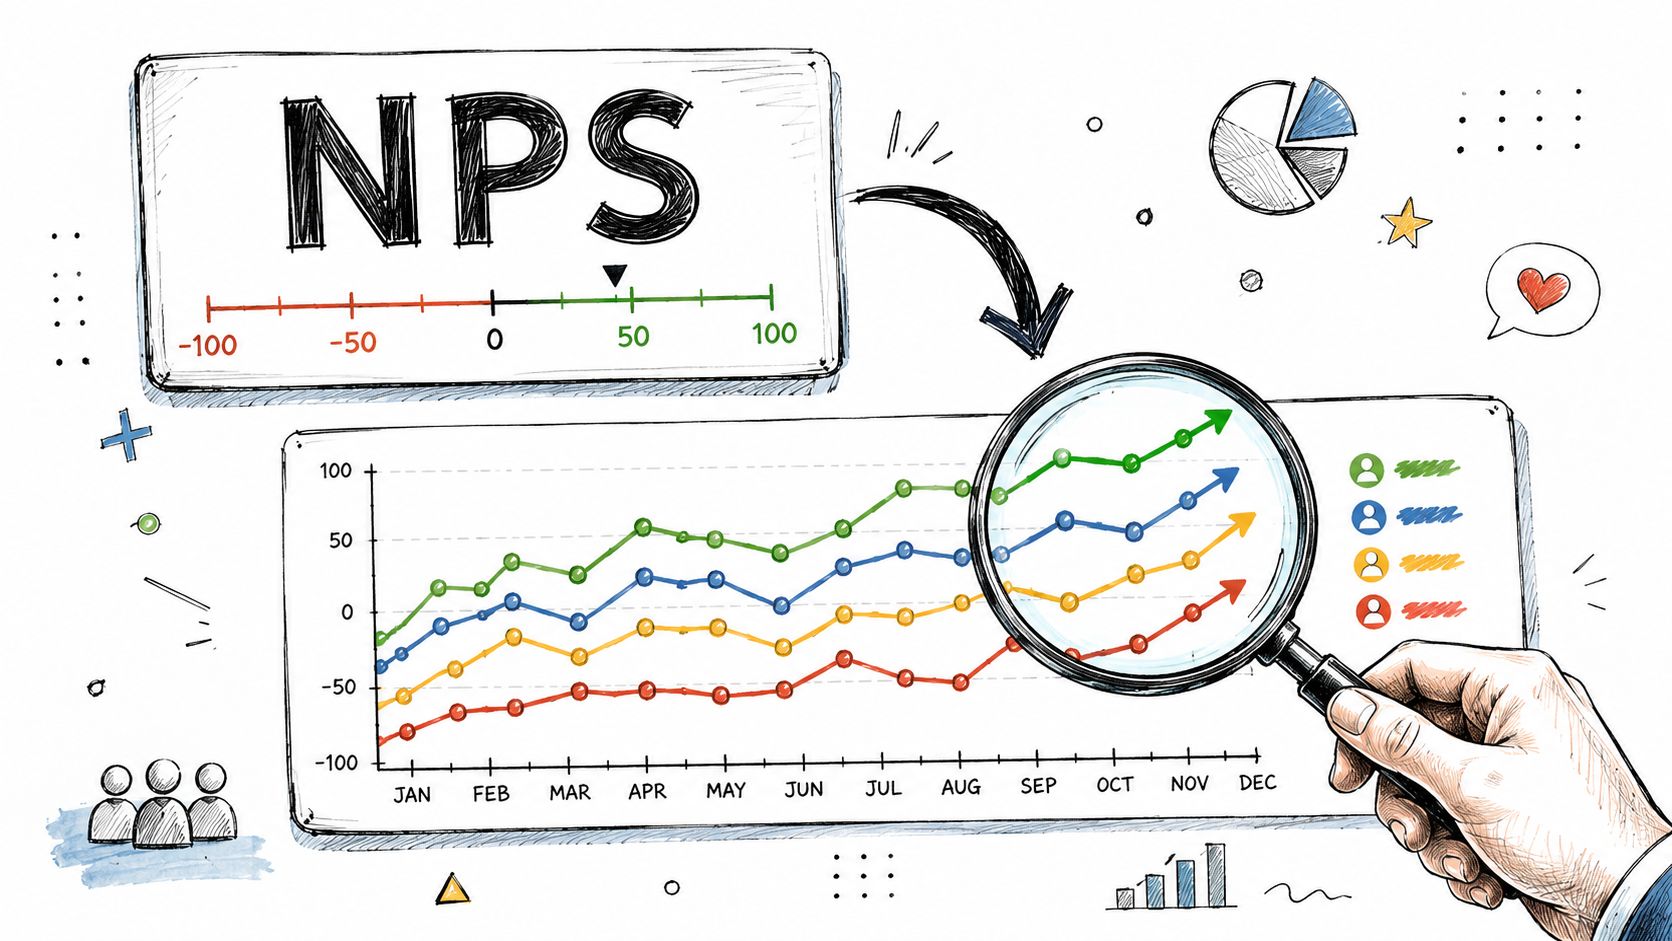
The overall score is a snapshot. Decisions require a trend line and segmentation.
Trajectory matters more than a snapshot
Most NPS analysis often gets shallow. Teams compare one score to a benchmark and stop there.
That misses the strongest signal. Sopact's NPS benchmark discussion notes that Bain's original benchmark thinking emphasizes trajectory on the same customer base over time as the honest measure of progress, not the standalone number. The same source also highlights why context matters so much: a score of 30 can be excellent in airlines and poor in consumer electronics.
That's the operating truth product teams need. A stagnant score can hide stalled progress. An improving score inside the right segment can signal that a real fix is taking hold.
Here's how to read trajectory usefully:
- Rising overall score: Usually means broad experience improvements are landing.
- Flat overall score with rising new-customer score: Often means onboarding got better before mature cohorts moved.
- Falling score in a premium segment: Treat it as an early commercial risk, not just a CX issue.
- Volatile score from small samples: Don't draw sweeping conclusions until you see consistency.
Segment the score by revenue reality
The most useful NPS cut is rarely overall NPS. It's segment NPS.
Look at sentiment by plan tier, contract size, tenure, use case, onboarding stage, support volume, and product area. The purpose isn't to create more dashboards. It's to find where customer frustration overlaps with revenue exposure.
A simple segmentation view might look like this:
| Segment | What to look for |
|---|---|
| New customers | Onboarding friction and activation gaps |
| Long-tenured accounts | Product stagnation or support fatigue |
| High-value plans | Revenue risk and expansion blockers |
| Low-usage customers | Weak value realization |
For many teams, the next step is combining NPS comments with qualitative review methods like a structured customer feedback analysis workflow. That's where trends become themes you can assign to product, support, or success.
Don't ask whether your NPS is good. Ask whether the right customer segments are getting happier for the right reasons.
That question usually leads to better decisions.
Common NPS Measurement Pitfalls to Avoid
A misleading NPS program is worse than no NPS program. At least no program doesn't create false confidence.
Bad timing creates fake confidence
Survey timing shapes the score. If you only ask after a successful onboarding call, you'll collect a warmer view than if you ask after customers have tried to integrate the product with their real workflow.
The best timing depends on your business model, but the principle is simple. Survey after customers have had enough exposure to form a real opinion. Don't survey so early that you're only measuring first impressions, and don't wait so long that only your happiest survivors respond.
Watch for these timing mistakes:
- Post-win bias: Surveying right after a support save or successful launch call.
- Renewal-only bias: Hearing mostly from customers who were already likely to stay.
- Inconsistent cadence: Changing timing every cycle and then comparing the results as if they mean the same thing.
Survey design mistakes that distort the result
NPS works best when the survey stays short and neutral. Teams often break that by trying to steer the answer.
Common errors include:
- Leading language: Framing the product as helpful or loved before asking the score.
- No open text field: Collecting numbers with no explanation, which leaves the product team guessing.
- Too many extra questions: Turning a one-minute pulse into a mini research project.
- Missing context fields: Failing to connect feedback to plan type, lifecycle stage, or account owner.
A short follow-up prompt for the reason behind the score usually does more work than adding several broad questions. The score tells you intensity. The comment tells you why.
Gaming the score breaks the system
This one shows up more often than people admit. Teams coach customers to give a high score, hide the survey from unhappy users, or pressure frontline staff to “protect NPS.” That usually produces prettier dashboards and worse decisions.
If people inside the company treat detractors as an embarrassment, customers stop telling the truth and teams stop hearing the truth.
The point of NPS isn't to prove customers love you. It's to locate friction before it turns into churn.
A trustworthy NPS program has a few traits:
- It invites honest criticism without punishing the teams who receive it.
- It makes low scores visible to the people who can fix the issue.
- It connects comments to action instead of filing them away in a report.
- It stays consistent enough that changes in the score can mean something.
If measurement quality is weak, don't debate the benchmark yet. Fix the instrument first.
From Score to Action How to Improve NPS and Reduce Churn
Improving NPS doesn't start with trying to “improve NPS.” It starts with fixing the reasons customers hesitate to recommend you.
Turn comments into operating priorities
Open-text feedback is a key asset. Read enough responses and patterns show up fast. Customers usually tell you where the experience breaks: setup friction, confusing billing, missing workflows, weak support follow-through, or value that takes too long to materialize.
The right move is to group responses by theme and route each theme to an owner.
- Product themes: Missing capability, poor usability, reliability complaints.
- Customer success themes: Slow time-to-value, unclear setup, weak handoffs.
- Support themes: Resolution speed, quality, escalation gaps.
- Commercial themes: Packaging confusion, pricing friction, plan mismatch.
Once themes are grouped, prioritize by business impact. A recurring complaint from accounts with meaningful recurring revenue deserves attention before a low-stakes annoyance from casual users.
Treat detractors like churn signals
In SaaS, detractors aren't just unhappy respondents. They're often early warning signals.
If a customer says the product doesn't justify the price, lacks a needed workflow, or keeps creating manual work, that response should influence retention plays before the customer reaches the cancel page. Teams that treat NPS as isolated survey data leave money on the table because they fail to connect sentiment to account behavior.
A practical retention motion usually includes:
- Flag the response inside the customer record.
- Attach account context such as plan, usage, and revenue value.
- Route urgent cases to a human follow-up when the account matters.
- Feed repeat reasons into churn analysis and cancellation flows.
If you're trying to connect experience signals with retention outcomes, this is closely related to the broader work of how SaaS teams reduce churn rate with better intervention design.
Build a closed loop with product and retention teams
Most companies often stall at this point. They collect NPS, summarize themes, and then never build the loop that changes behavior.
A useful closed loop has three parts:
| Part | What good looks like |
|---|---|
| Capture | Score plus clear reason, tied to account context |
| Triage | Themes assigned to the team that can act |
| Follow-through | Product fixes, customer outreach, and retention plays based on the issue |
You also need to make the insight visible where churn decisions happen. If a customer later enters a cancellation flow, their earlier complaints shouldn't live in a separate survey tool that nobody checks. The retention motion should reflect what they already told you.
This kind of workflow is easier to picture when you look at a real cancellation and recovery environment:
The important shift is mental. Stop asking, “How do we raise the score?” Ask, “What complaint patterns are most likely to cost us recurring revenue, and who is fixing them this sprint?” Teams that work that way often end up with a better score anyway, but that's the byproduct, not the strategy.
Frequently Asked Questions About Net Promoter Score
Should you survey every customer
Not necessarily. You want coverage that's representative, not noisy. If you survey customers at random moments with no logic, you'll collect a messy blend of early excitement, support frustration, and dormant-account indifference.
A better approach is to choose moments when customers have enough experience to judge the relationship, then keep that timing consistent.
Is NPS enough on its own
No. NPS is a sentiment indicator. It tells you how customers feel about recommending you. It doesn't tell you by itself whether usage is deep, whether expansion is likely, or whether failed payments are causing avoidable churn.
For subscription businesses, NPS is strongest when paired with lifecycle and commercial context such as plan, tenure, product adoption, support history, and cancellation reasons.
What should you ask after the score question
Ask for the reason behind the rating. Keep it short and neutral.
The biggest mistake here is overbuilding the survey. One clean follow-up usually delivers more value than a long list of extras. You need enough detail to understand the driver, not a research dissertation.
Can a low score still be useful
Absolutely. In many cases, a low score is more useful than a flattering one because it points to a clear fix.
A team that gets candid detractor feedback has something concrete to work with. A team with a decent-looking average and vague passive comments often has less clarity. Bad news with specifics is operationally better than good news with no direction.
A useful NPS program doesn't protect egos. It helps the company make better retention, product, and customer experience decisions.
If you keep that standard, the benchmark question becomes easier to answer. A good Net Promoter Score is one that reflects real customer progress and leads to action that protects recurring revenue.
If your team wants to move from collecting churn reasons to acting on them, Revcover is built for that operational layer. It helps subscription software companies capture cancellation intent, route customers into customized save paths, recover failed payments, and tie outcomes back to recovered recurring revenue so feedback doesn't die in a spreadsheet.