
Time to Value: The SaaS Metric to Cut Churn & Grow MRR

Ayush Soni
Founder, Revcover

On this page
- Why Your Churn Report Is Lying to You
- Churn reasons describe symptoms
- Feature velocity can hide the underlying problem
- What Is Time to Value Really
- The moment that counts
- What should not count
- Why speed changes the economics
- How to Measure and Benchmark Your TTV
- Define value in a way finance and product both accept
- Use the median, then segment hard
- Look for the segment where slow TTV turns into revenue risk
- Use a fast diagnostic before rebuilding the journey
- Strategies to Shrink Your Initial TTV
- Cut setup steps that don't prove value
- Build onboarding around one milestone
- Use contextual help where users stall
- Beyond Onboarding The Untapped Power of Restoration TTV
- Why retention teams need a second TTV metric
- What restoration time to value looks like in practice
- How to instrument restoration TTV
- Make Time to Value Your Company's North Star
You're probably looking at a churn dashboard that feels more accusatory than useful. Customers are leaving, revenue is slipping, and the reasons field is full of vague labels like “no longer needed,” “too expensive,” or nothing at all. Product thinks the issue is missing features. Success thinks it's onboarding. Marketing thinks acquisition quality dropped.
Most of the time, the churn report isn't wrong. It's incomplete.
The missing layer is time to value. Not as a buzzword, but as the operating metric that explains why users cancel before they can clearly describe what went wrong. When someone never reaches meaningful value, they often can't name the failure in a survey. They just leave. That's why so many SaaS teams chase churn with more features, more emails, and more win-back campaigns, yet still can't connect product work to reduced churn or recovered MRR.
The shift that changes this is simple to describe and harder to implement. Stop asking, “What did we ship?” Start asking, “How fast did the customer get value, and how fast did we restore it when something broke?”
Why Your Churn Report Is Lying to You
Monday morning. The churn dashboard says 6.8% of last month's cohort canceled. Product sees a retention problem. Finance sees lost MRR. Support sees a list of exit reasons like “too expensive” and “not using it enough.” None of those views answer the question that matters most. How many of those customers reached a moment where the product proved its worth?
That missing timestamp changes how you diagnose churn.
In subscription businesses, many cancellations happen before the customer experiences a clear, repeatable benefit. They signed up with intent, completed a few setup steps, maybe invited a teammate, then stalled before the product solved the job they bought it for. The churn report captures the cancellation date. It usually does not capture the delay between signup and value, or whether value happened at all.
That is why churn reports often send teams toward the wrong fix. If you only study why people left, you end up optimizing cancellation flows, discount offers, and win-back copy. If you measure how long it took customers to get value, you can find the revenue leak much earlier.
Churn reasons describe symptoms
“Too expensive” often means the product never became important enough to justify the charge.
“Not using it” often means the customer never formed a habit because the first useful outcome arrived too late, or never arrived at all.
Those labels still matter, but they are weak diagnostic tools on their own. They describe the final objection, not the operating failure that created it.
Practical rule: If a customer cancels before reaching a validated value milestone, treat the stated reason as downstream of a value-delivery problem.
Feature velocity can hide the underlying problem
I have seen teams ship fast for a full quarter and still lose the same kinds of customers. More integrations. Better reporting. Cleaner UI. Healthy release notes. Flat activation. Flat retention. The team was building more product, but not shortening the path to the first outcome customers cared about.
That trade-off matters. A roadmap can look productive while revenue quality gets worse underneath it.
Churn reporting alone tells you who left. Time to value tells you whether they ever got the benefit they were paying for.
A better operating question is this:
| Churn view | TTV view |
|---|---|
| Why did they cancel? | How long did it take them to experience real value? |
| Which reason did they select? | Which step delayed or blocked the value moment? |
| Which offer saved them? | Did they see enough value for a save offer to matter? |
This lens also changes how retention work is measured. Standard TTV explains the risk on the front end. Restoration Time to Value explains the recovery path after an account becomes inactive, misses a payment, or shows clear churn signals. If a customer drops into trouble, the retention question is not only whether you can save them. It is how quickly you can restore them to a value state that supports continued payment and lower churn.
That is the metric many churn reports miss. They count the loss, but they do not measure how fast your team can re-establish value and recover MRR before the account is gone for good.
What Is Time to Value Really
A new customer signs up on Monday. By Friday, they have completed setup, invited teammates, and clicked through every onboarding prompt. The account still feels fragile because none of those actions prove the product solved the problem that justified the purchase.
That gap is what time to value measures.
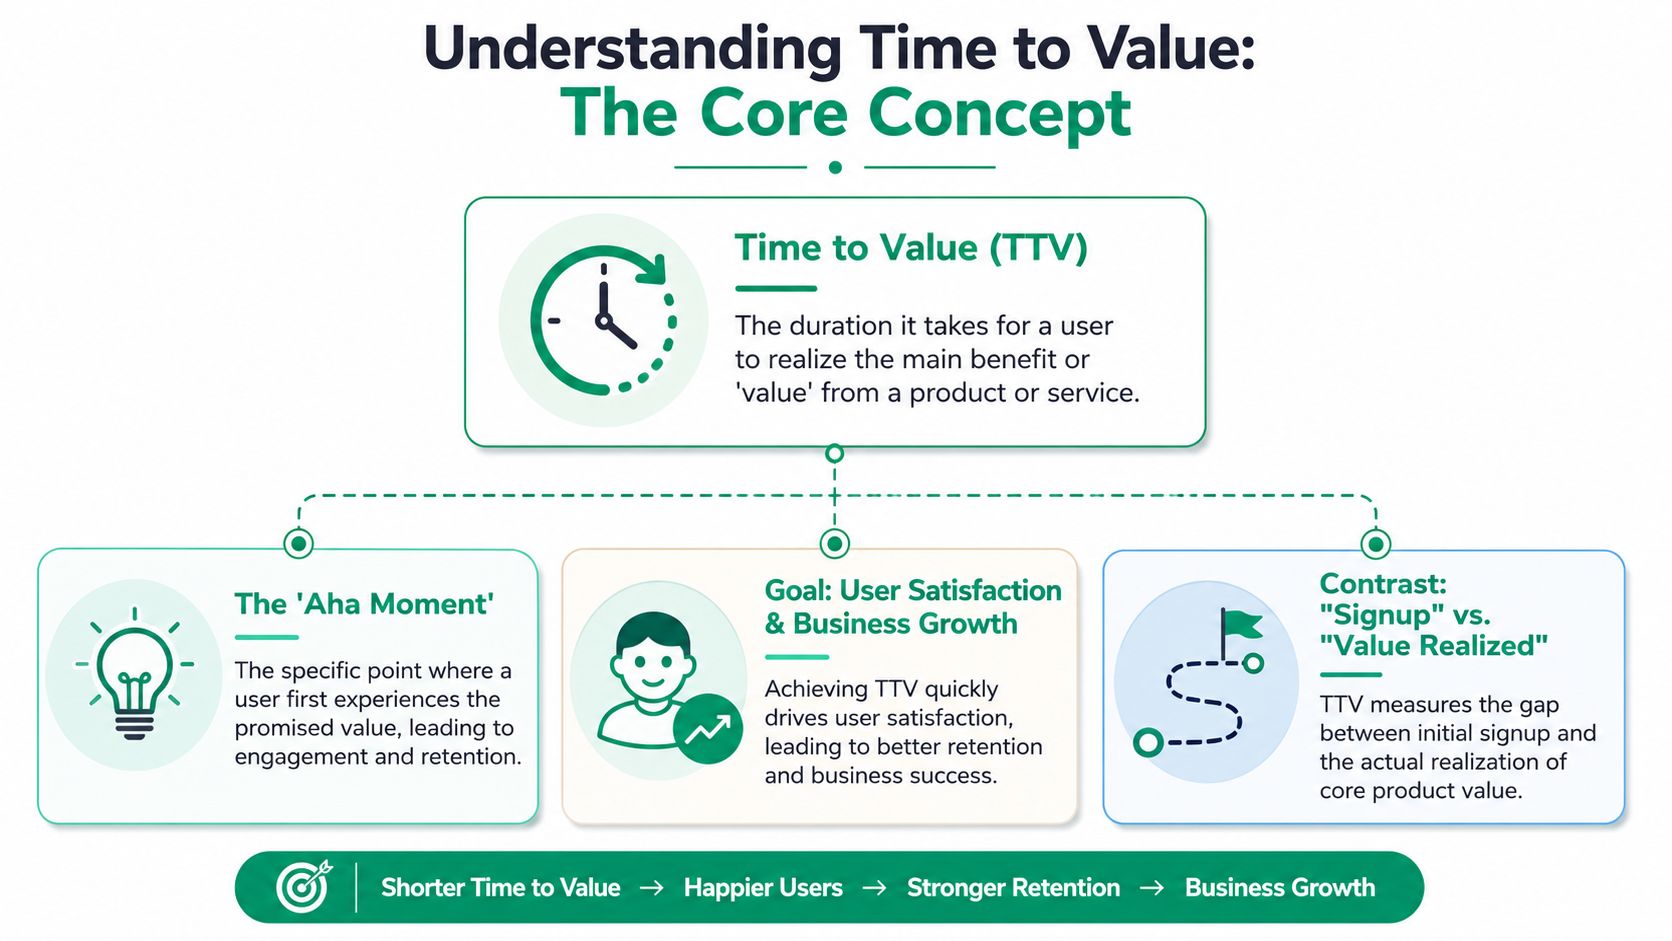
Time to value is the elapsed time between the start of the customer relationship and the first meaningful outcome the customer gets from the product. The keyword is meaningful. If the event does not reflect the job the customer hired the product to do, it is not a value moment. It is only progress toward one.
In practice, teams often get sloppy. They use convenient product events as stand-ins for value because they are easy to instrument and easy to report. I have seen teams call workspace creation, script installation, or first login "activation" and then wonder why those accounts still churned. The event was real. The value was not.
The moment that counts
The right value moment sits close to the product promise and close to revenue outcomes.
For an API product, that might be the first successful data sync that runs in production. For a CRM, it could be the first live sales activity that gives a manager usable pipeline visibility. For an analytics tool, it may be the first report a team uses to make a decision. For a billing recovery product, the value moment may be a recovered payment or a saved subscription, because that is when the customer sees revenue impact rather than setup progress.
That distinction matters because onboarding TTV is only half the story. If an account goes inactive, misses payment, or shows clear churn risk, the same logic applies again. The retention team needs to restore the customer to a value state quickly. That is Restoration Time to Value. It measures how long it takes to re-establish value after disruption, not just how long it took to create value the first time.
What should not count
Teams usually overstate value by choosing milestones that are administratively useful but commercially weak.
These events are common examples:
- Signup completion: clear intent, but no proof of benefit
- Checklist completion: a customer can finish tasks and still get no outcome
- Seat invites: collaboration setup matters, but setup alone does not retain an account
- Session count: repeated logins can signal confusion just as easily as engagement
A better filter is simple. The event should be behavioral, observable, and meaningfully connected to retention, expansion, or payment recovery. If you need a stronger framework for that, this guide to product engagement metrics that map activity to customer outcomes is a useful companion.
Why speed changes the economics
Speed matters because delayed value creates room for doubt. Every extra day between signup and first outcome increases the chance that the buyer deprioritizes the product, the champion loses internal momentum, or the team falls back to an old workflow.
There is also a resource trade-off inside the business. Long TTV forces customer success, support, and lifecycle teams to spend more time pushing accounts toward an outcome that the product should help deliver earlier. That raises service cost and weakens expansion odds. Shorter TTV improves conversion from trial to paid, strengthens early retention, and gives recovery teams a better chance of saving revenue when an account slips.
The same economic logic applies to Restoration Time to Value. Saving a failed payment is useful. Restoring the account to active product value is what protects recurring revenue. If the customer comes back only to hit the same friction that caused disengagement in the first place, recovered MRR will disappear again a few weeks later.
Teams that understand this stop treating feature completion as the finish line. They focus on the first outcome that predicts a healthier account, then remove whatever slows customers down on the way there.
How to Measure and Benchmark Your TTV
A team can ship faster every sprint and still miss revenue targets if customers are slow to reach value.
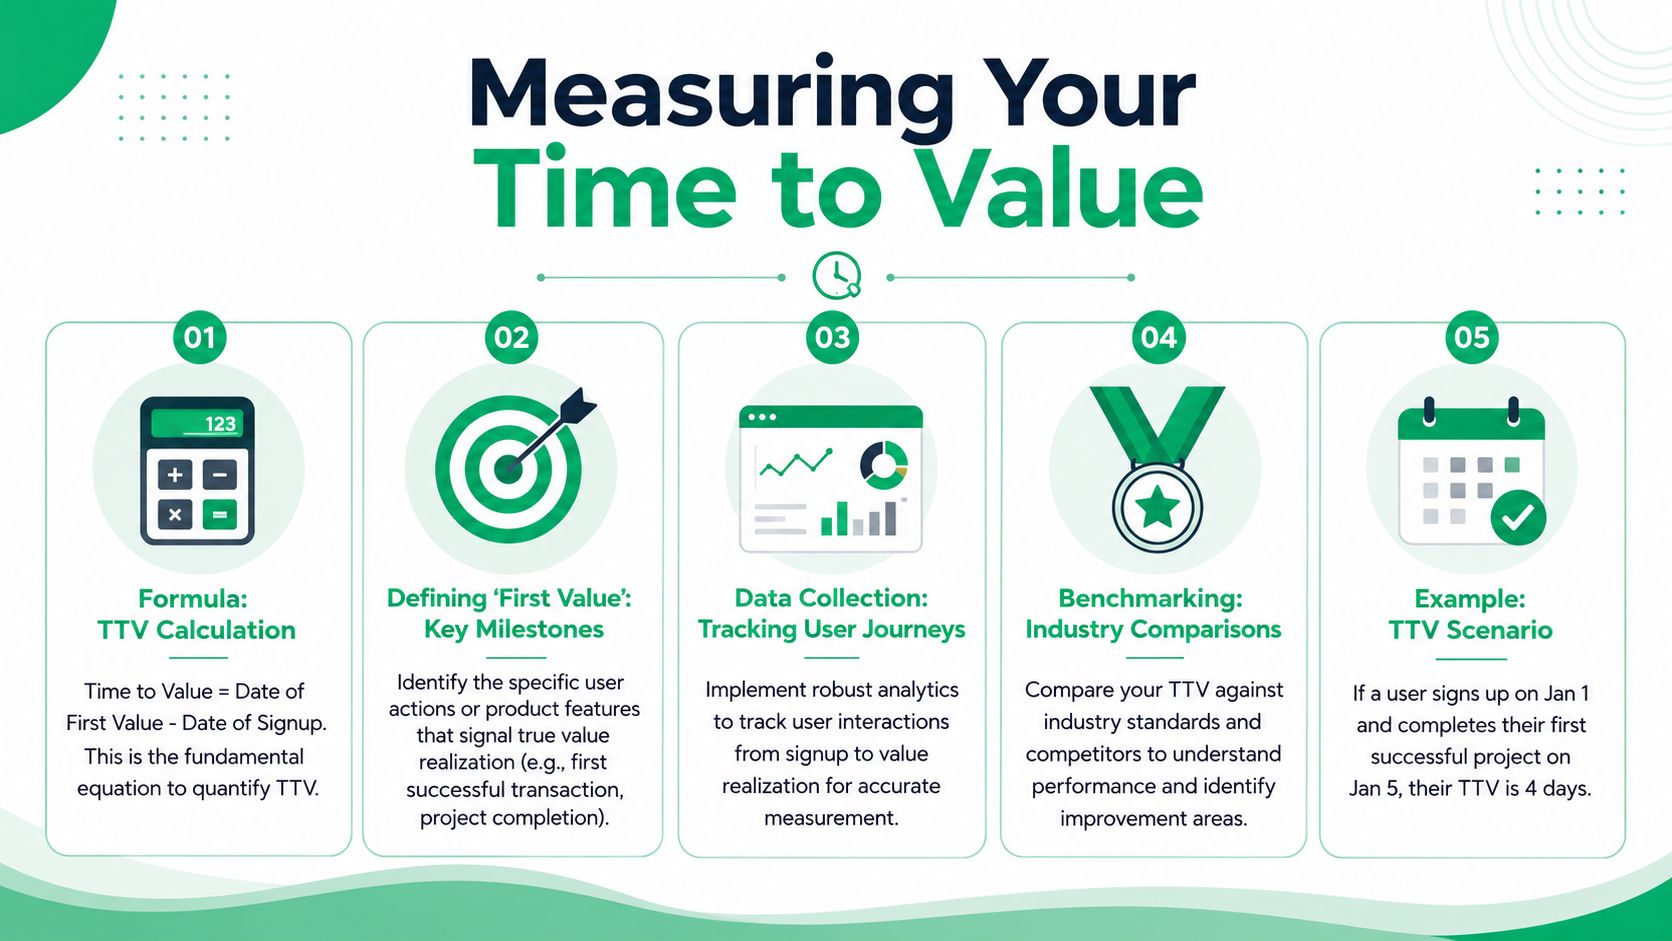
That usually starts with a measurement mistake. The formula is simple: Time to value = Date of First Value − Date of Signup. The hard part is deciding what “first value” means. If that event is too shallow, the metric looks healthy while churn, failed expansions, and preventable downgrades keep climbing.
Define value in a way finance and product both accept
The cleanest definition of first value passes three tests:
- It's behavioral. The event can be tracked in Mixpanel, Amplitude, or your warehouse.
- It reflects the product promise. The customer has achieved a meaningful outcome, not completed setup.
- It predicts retention. Accounts that hit the milestone should renew, expand, or stay active at higher rates than accounts that do not.
For B2B SaaS, I prefer measuring TTV at the account level. That matches how contracts, renewals, and churn are decided. Koji's guide to time to value measurement makes the same point and also recommends validating the milestone against cohort performance, not just product intuition.
This matters even more once you look beyond onboarding. A customer can recover a failed payment and still be nowhere near value. That account is technically retained, but commercially fragile. The same measurement discipline you use for initial TTV should later be applied to Restoration Time to Value, which tracks how quickly an at-risk customer gets back to meaningful product value after recovery.
Use the median, then segment hard
Teams that report average TTV often smooth over the exact friction they need to fix.
The Baremetrics guide to time to value recommends using median TTV instead of mean TTV because outliers distort the average. That matters in any mix of self-serve and high-touch accounts. A few long enterprise implementations can make the whole onboarding motion look broken, even when the typical customer experience is acceptable.
A single top-line number is still too blunt. Break TTV down by acquisition channel, persona, plan tier, and sales motion. If your team already tracks engagement metrics that connect product activity to customer outcomes, TTV belongs near the top because it explains whether engagement is productive or just busy. High usage before first value often signals confusion, not progress.
Look for the segment where slow TTV turns into revenue risk
A useful TTV report should make it obvious where money is being lost, not just where onboarding feels clunky.
| Segment | What a slow TTV often means |
|---|---|
| Paid acquisition | The promise in ads or landing pages does not match the first in-product path |
| Enterprise plan | Setup complexity or implementation dependencies are delaying adoption |
| Self-serve trial | The product asks for too much configuration before showing a result |
| Specific persona | Messaging sells one workflow, while onboarding assumes another |
I've seen this show up in paid channels repeatedly. One campaign drives narrowly qualified signups who know exactly what they want to do, so TTV looks strong. Another campaign brings in broader traffic with weaker intent, and those accounts stall before the first meaningful outcome. Same product. Different starting context. Different economics.
That is why “improve onboarding” is not an actionable diagnosis. The fix usually sits in one segment, one step, and one broken expectation.
Use a fast diagnostic before rebuilding the journey
Koji also offers a useful threshold for triage. The guide suggests a day-7 activation check, where fewer than 7% of users reaching the value milestone within seven days is a sign the onboarding path needs immediate attention.
Start with the first point where progress drops. Check whether the blocker is a permission request, empty state, integration dependency, unclear next action, or poor handoff from sales. Teams waste months redesigning full onboarding flows when one broken step is doing most of the damage.
A practical measurement loop looks like this: define the value milestone, calculate median TTV, segment it by revenue-relevant cohorts, review drop-off before first value, ship one fix, then measure the retention or recovery impact. The point is not a cleaner dashboard. The point is getting customers to value faster so more of them stay, expand, and return to healthy recurring revenue after they slip.
Strategies to Shrink Your Initial TTV
A new account signs up with real buying intent, hits three setup screens, stalls on an integration step, and goes quiet. Product calls it incomplete onboarding. Finance feels it later as higher churn, lower expansion, and preventable MRR loss.
That is the operating problem. Initial TTV is not a UX score. It is the time between commitment and proof.

Cut setup steps that don't prove value
Teams usually slow TTV for internal reasons. Legal adds fields. Sales asks for qualification data. Product wants a full configuration before the user sees anything useful. I have seen all three in the same flow, and none helped revenue until we tied each step to activation and retention.
Review each step with one hard question: does this increase the odds of first value in this session or the next one?
If not, move it later, automate it, or delete it.
The usual friction points are familiar:
- Long welcome forms: Ask only for information that changes the next action.
- Blank states: Preload templates, sample data, or a recommended setup path.
- Premature integrations: Show a useful outcome before asking for a full implementation.
- Too many starting paths: Direct users to the first action most closely tied to activation.
One shortcut helps here. Review support tickets, onboarding call notes, and customer feedback analysis patterns together. The same friction usually shows up in all three places, and it often points to one broken moment rather than a weak onboarding experience overall.
Build onboarding around one milestone
Feature tours make teams feel thorough. They rarely get users to value faster.
Strong onboarding is organized around one milestone that proves the product works for the customer. In a reporting product, that might be the first live dashboard. In a billing tool, it might be the first recovered payment. In a collaboration app, it might be the first shared workflow completed by a team, not a lone user clicking around.
That choice matters because every asset around onboarding starts to align. The checklist, welcome email, empty state, prompts, and customer success follow-up should all reinforce the same outcome. If each surface pushes a different task, users do more work and get less conviction.
A strong first-session flow usually has these traits:
| Element | What works | What fails |
|---|---|---|
| Welcome screen | Asks what the user wants to achieve | Lists product features |
| Checklist | Focuses on one or two value-driving actions | Includes billing and profile busywork |
| Empty state | Shows the fastest next step | Shows a generic dashboard with no direction |
| Nudges | Trigger at the moment of hesitation | Fire on a schedule regardless of context |
Field note: A checklist should feel like assisted progress, not a scavenger hunt assembled from internal requirements.
This walkthrough gives a good visual for how to guide users toward that first meaningful outcome:
Use contextual help where users stall
Static tours front-load information before intent exists. Contextual help works better because it responds to behavior.
If a user opens the integration page and pauses, show a short explanation of the minimum setup needed to get a result. If they revisit the same step twice, trigger help for that specific blocker. If they land on an empty dashboard, offer a template or sample output that produces a quick win. High-value accounts may justify human outreach at that point. Lower-value cohorts usually need better product guidance, not more CSM time.
The pattern is simple:
- Detect hesitation: repeated visits, long dwell time, or abandonment on a key action
- Respond in context: inline help, a tooltip, a checklist prompt, or targeted outreach
- Push toward the milestone: every assist should reduce time to first value
This is also where initial TTV connects to restoration TTV later in the lifecycle. Teams that teach users how to get value quickly the first time usually recover value faster after billing issues, failed renewals, or account friction. The mechanics are similar. Remove delay, restore confidence, and get the customer back to a meaningful outcome fast.
Beyond Onboarding The Untapped Power of Restoration TTV
Most SaaS teams treat time to value as an acquisition and onboarding metric. That's useful, but incomplete. Customers can also lose value after they've already activated.
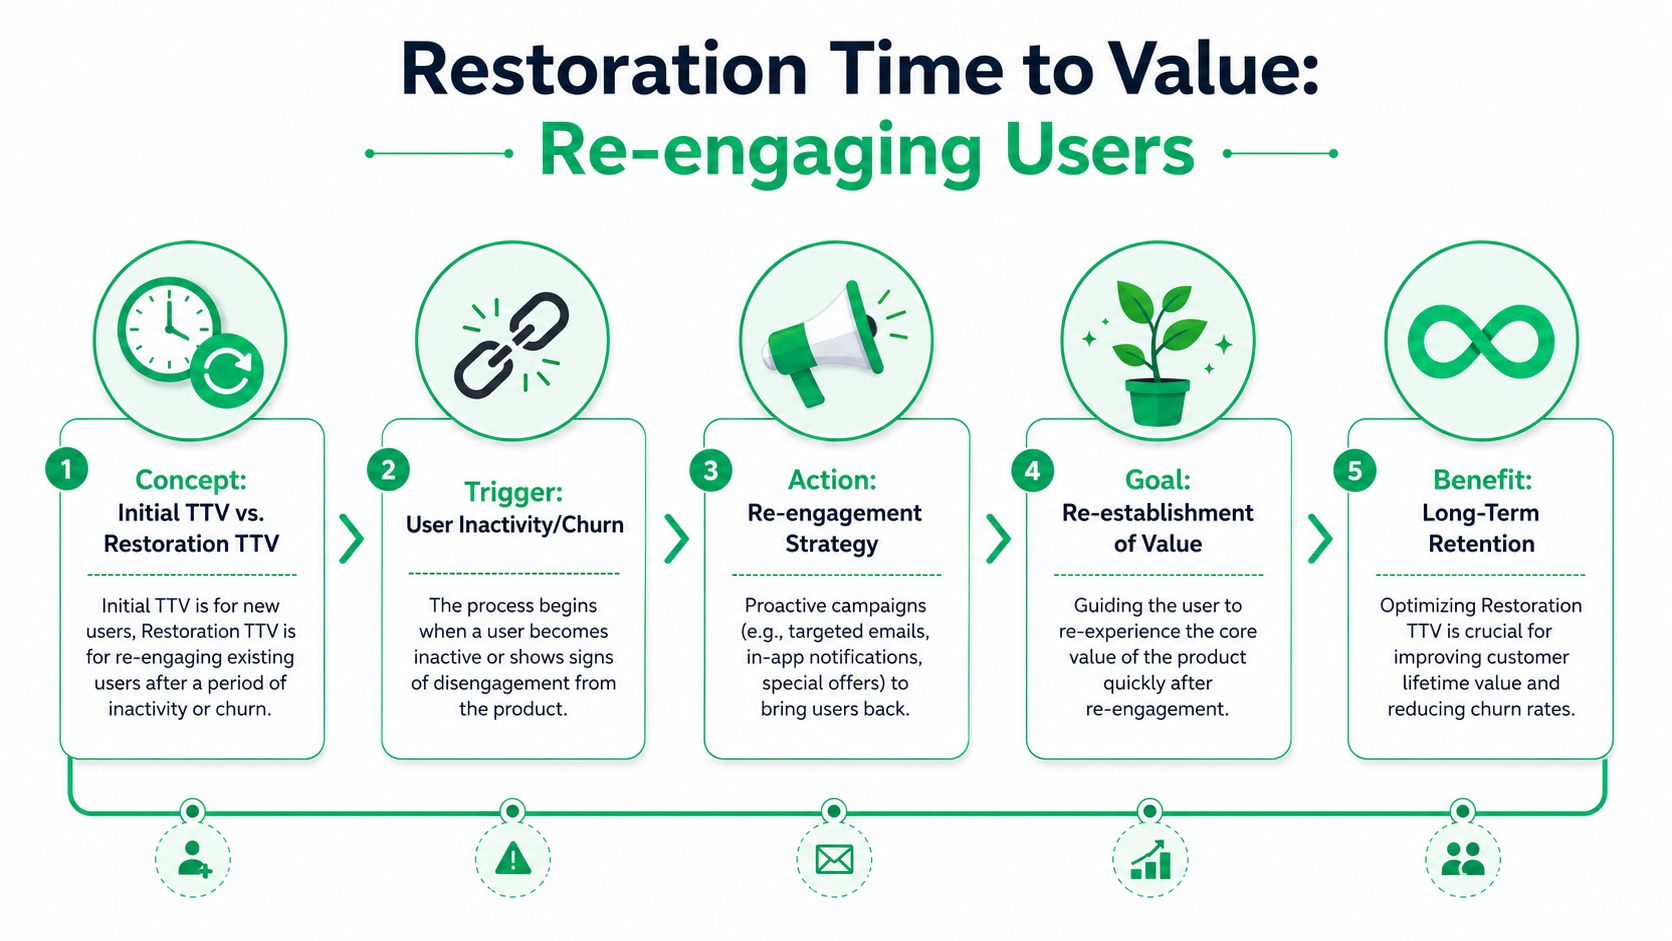
A failed payment, service interruption, unwanted downgrade, or clumsy cancellation flow can break the customer's sense of continuity. At that moment, the question isn't whether they reached value the first time. It's how quickly they can feel value again.
That's restoration time to value.
Why retention teams need a second TTV metric
This is a blind spot in a lot of growth reporting. Traditional TTV assumes a straight line from signup to first value. Real subscription businesses don't operate in straight lines.
Meltingspot's discussion of reducing SaaS time to value points to this gap directly. It argues that existing content rarely addresses post-activation TTV decay, and states that 40% of churn occurs not during initial onboarding but after a user experiences a service interruption or billing friction.
That matters because a customer who already understands your product can still churn if the recovery experience is slow, confusing, or impersonal.
What restoration time to value looks like in practice
Think about three common scenarios.
A customer hits a failed payment and gets a generic billing email with no direct path back to a working subscription. Their issue isn't awareness. It's friction. Restoration TTV is the time between the payment problem and the moment access, confidence, and product continuity are restored.
Another customer starts a cancellation flow because their current plan no longer fits. If the only option is “cancel” or “contact support,” value remains broken. But if the flow offers a relevant downgrade, a pause, or a path that matches their actual usage pattern, the account can return to a state where the product still feels worthwhile.
A third account loses momentum after an interruption. They don't need a new-feature announcement. They need a guided route back to the workflow they already trusted.
That's why retention teams should spend time on analyzing customer feedback for churn and recovery signals. The words customers use during cancellation intent or payment failure often reveal what type of restoration path can re-establish value fastest.
A save flow doesn't create value by existing. It creates value when it removes the specific barrier that made the customer question staying.
How to instrument restoration TTV
This metric should be defined just as rigorously as initial TTV.
A practical restoration framework looks like this:
- Define the trigger event. Failed payment, cancellation intent, involuntary downgrade, or interruption.
- Define the restored-value event. Updated payment method, accepted pause, successful downgrade, reactivated access, or resumed use of a core workflow.
- Measure elapsed time. The gap between disruption and restored value.
- Segment by cause. Billing issues, pricing mismatch, missing feature, temporary inactivity, support dissatisfaction.
- Connect it to revenue outcomes. Which recovery paths restore customer value quickly enough to prevent avoidable churn.
The trade-off here is important. Aggressive save tactics can lower short-term cancellations while damaging trust if the offer is irrelevant or obstructive. Fast restoration only matters when the customer feels the path is fair and useful.
Good retention systems don't trap users. They resolve the interruption cleanly, present relevant options, and make the route back to value obvious. That's what turns a churn moment into a recovery moment.
Make Time to Value Your Company's North Star
The strongest teams don't treat time to value as a product metric sitting in a dashboard nobody else checks. They use it as a shared operating principle.
Marketing influences it by setting the right expectation before signup. Sales influences it by qualifying for the right use case instead of promising everything. Product influences it by reducing the work between start and payoff. Customer success influences it by removing blockers for complex accounts. Retention teams influence it by restoring value quickly when billing or cancellation friction appears.
That's why time to value is a better unifier than feature velocity. Shipping speed matters. But if releases don't help customers get to value faster or get back to value faster, they won't do much for churn or net revenue retention.
A practical company-wide loop looks like this:
- Choose the value event carefully: Validate the action that correlates with retention.
- Measure it: Use account-level and median views where appropriate.
- Find the stalls: Segment by channel, persona, and plan.
- Fix one major blocker at a time: Don't redesign everything.
- Add restoration measurement: Treat failed payments and cancellation intent as time-to-value problems too.
- Tie learning to revenue outcomes: The point isn't cleaner dashboards. It's lower churn and stronger expansion efficiency.
If you want a useful companion metric once customers are active, net dollar retention in SaaS helps show whether your delivered value compounds over time. But it starts earlier than many organizations think. Before expansion, before loyalty, before advocacy, the customer has to get value quickly and repeatedly.
Teams that internalize that stop building onboarding as a tour and start building it as a revenue system. They stop viewing retention as a rescue function and start treating it as continued value delivery.
That's the shift. Not more activity. Faster proof.
If you want to operationalize both initial time to value and restoration time to value, Revcover helps subscription SaaS teams intercept cancellation intent, recover failed payments, capture churn reasons in context, and connect save flows to recovered MRR. It's a practical way to turn retention from a reactive workflow into a measurable value-restoration system.