Improve Net Dollar Retention: Strategies for Growth
Ayush Soni
Founder, Revcover

On this page
- Why Net Dollar Retention Is a SaaS Superpower
- NDR changes the quality of growth
- Investors care because NDR exposes business quality
- Understanding the Core Concept of NDR
- The self-refilling revenue bucket
- What each moving part actually means
- How to Calculate Net Dollar Retention Accurately
- Use one fixed customer cohort
- A practical calculation workflow
- Monthly versus annual views
- NDR Benchmarks What Is a Good Score
- Why company size changes the target
- Common Measurement Pitfalls and Blind Spots
- When a healthy NDR hides unhealthy retention
- Billing states make attribution messy
- Actionable Strategies to Improve Your NDR
- Reduce churn before the cancellation posts
- Limit contraction with a downgrade strategy
- Increase expansion only after value is proven
- Measure the save path, not just the final outcome
- Conclusion Turning a Metric Into a Growth Flywheel
Net dollar retention becomes a different conversation when you realize this: an NDR of 120% can support 50%+ year-over-year growth without a single new customer, because expansion from the existing base more than offsets churn and contraction, as noted in this SaaS growth benchmark reference.
That's why founders who treat NDR as a finance metric usually move too slowly. Net dollar retention is an operating metric. It tells you whether your product, pricing, onboarding, support, billing, and account management are working together to make revenue stick and grow after the sale.
The mistake I see most often is simple. Teams track the headline percentage, celebrate when it looks healthy, and miss the mechanics underneath it. But NDR isn't one thing. It's the combined result of expansion, contraction, churn, and billing recovery. If you want to improve it, you need to influence each component deliberately.
Why Net Dollar Retention Is a SaaS Superpower
Founders love growth because it's visible. NDR matters because it tells you whether that growth is durable.
A business with strong net dollar retention doesn't need to replace lost revenue every month just to stand still. It can compound from inside the customer base. That changes how aggressively you can invest, how predictably you can forecast, and how much pressure your acquisition engine has to carry.
NDR changes the quality of growth
When NDR is healthy, your existing customers are doing part of the growth work for you. Renewals hold. Downgrades stay controlled. Expansion happens because customers are adopting more seats, more usage, or more value.
When NDR slips below the stability line, the opposite happens. Your go-to-market team spends energy backfilling avoidable loss. Sales has to outrun churn. Marketing looks productive on the surface while the base underneath keeps eroding.
Practical rule: If your existing customer base isn't retaining and expanding revenue, you don't have efficient growth. You have a replacement problem.
Investors care because NDR exposes business quality
NDR is one of the cleanest ways to see whether customers become more valuable over time. It strips away the noise of new logo acquisition and asks a harder question. Did the customers you already had produce more revenue, less revenue, or roughly the same?
That's why this metric has so much weight in board conversations. It connects directly to product value, pricing fit, onboarding quality, customer success execution, and billing operations. Few metrics force that many functions into the same reality.
For operators, the takeaway is straightforward. Net dollar retention isn't a dashboard ornament. It's the scoreboard for how well your business holds and grows revenue after the contract is signed.
Understanding the Core Concept of NDR
Many teams understand NDR faster when they stop thinking about spreadsheets and start thinking about a bucket.
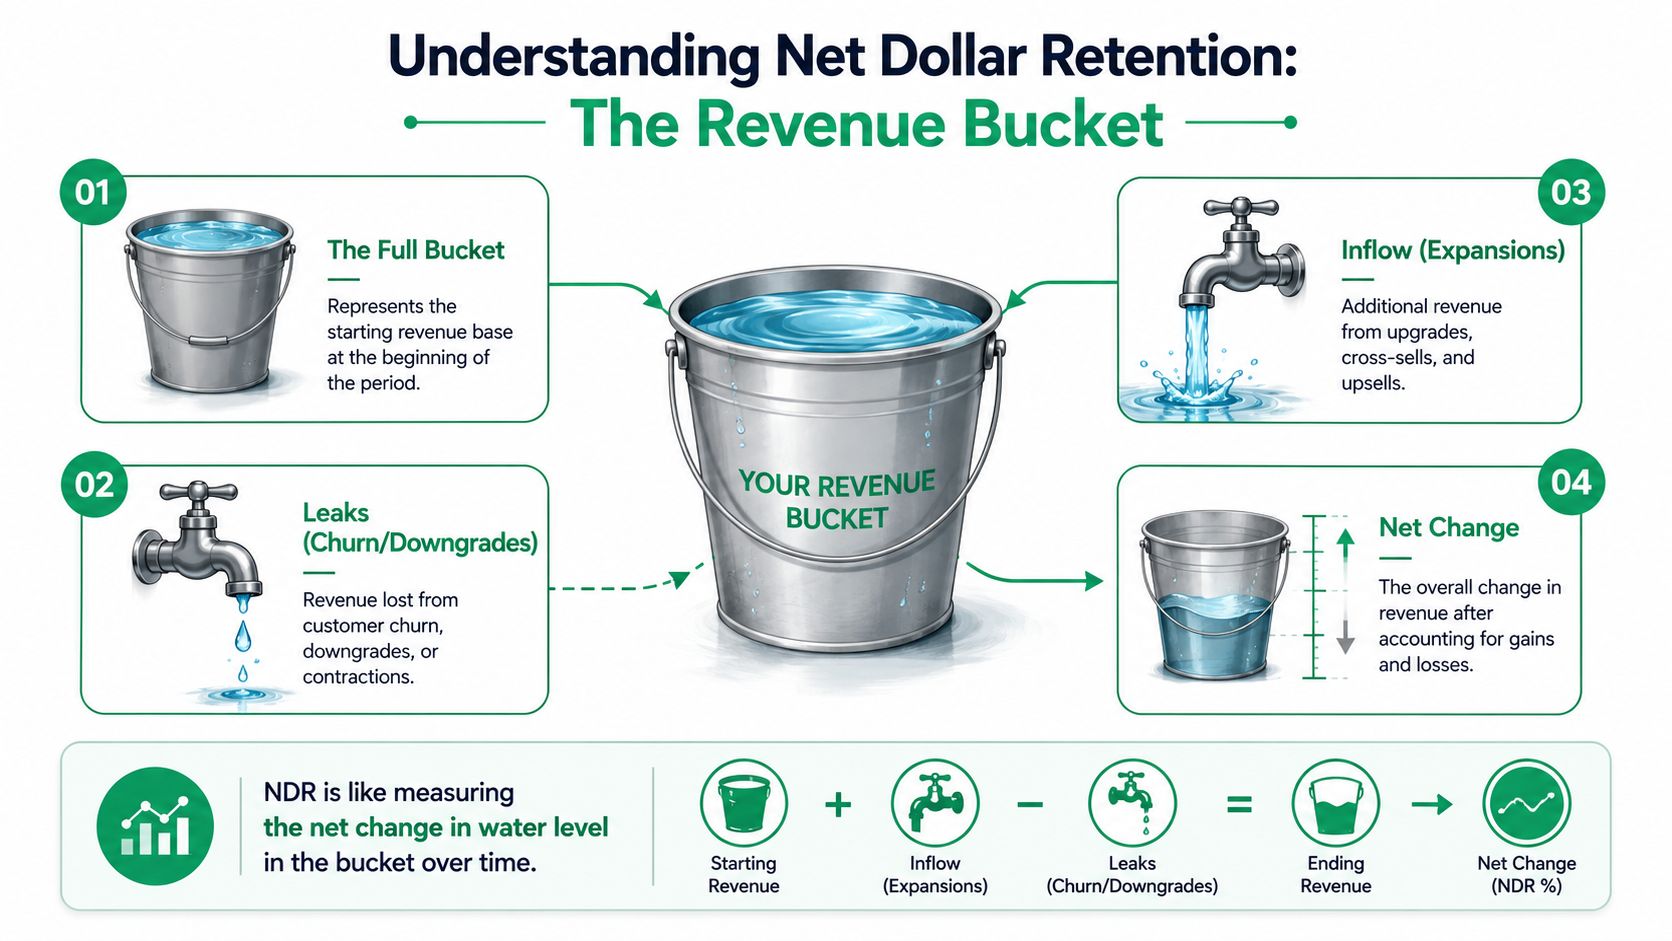
The self-refilling revenue bucket
Your starting revenue is the water already in the bucket at the beginning of the period. That's the customer base you already earned.
Then the month or quarter unfolds. Some water leaks out because customers cancel. Some leaks out more slowly because customers downgrade or reduce usage. At the same time, water flows back in from inside the same customer base through upgrades, cross-sells, seat additions, or deeper adoption.
Net dollar retention measures the change in water level after all of that movement.
If the bucket ends up at the same level, you're holding steady. If it's higher, your current customers are generating more revenue than they started with. If it's lower, your business is losing revenue inside the installed base, even if top-line growth still looks fine because new customers are filling the gap.
What each moving part actually means
The four components matter because each one points to a different operating problem.
- Starting revenue is the baseline. This is the recurring revenue from the cohort that already existed at the start of the measurement period.
- Expansion is added revenue from those same customers. In practice, this comes from upgrades, added seats, extra usage, or broader product adoption.
- Contraction is revenue that stays in the account but shrinks. Think plan downgrades, seat reductions, or lower usage.
- Churn is revenue that disappears because the customer leaves or fails to renew.
That distinction between contraction and churn is where a lot of teams get sloppy. They lump everything into “lost revenue,” which hides useful insight. A downgrade and a cancellation are not the same operational problem. One often signals price pressure, over-packaging, or temporary budget stress. The other may signal failed onboarding, weak product fit, or competitive displacement.
A good NDR review doesn't stop at the percentage. It asks which motion changed, why it changed, and which team can influence it.
A key reason NDR is so useful is that it combines all of these customer revenue movements into one outcome. You can't fake it with pipeline language. If the product isn't sticky, if pricing is brittle, or if billing recovery is weak, the number eventually shows it.
How to Calculate Net Dollar Retention Accurately
The formula is simple. The implementation usually isn't.
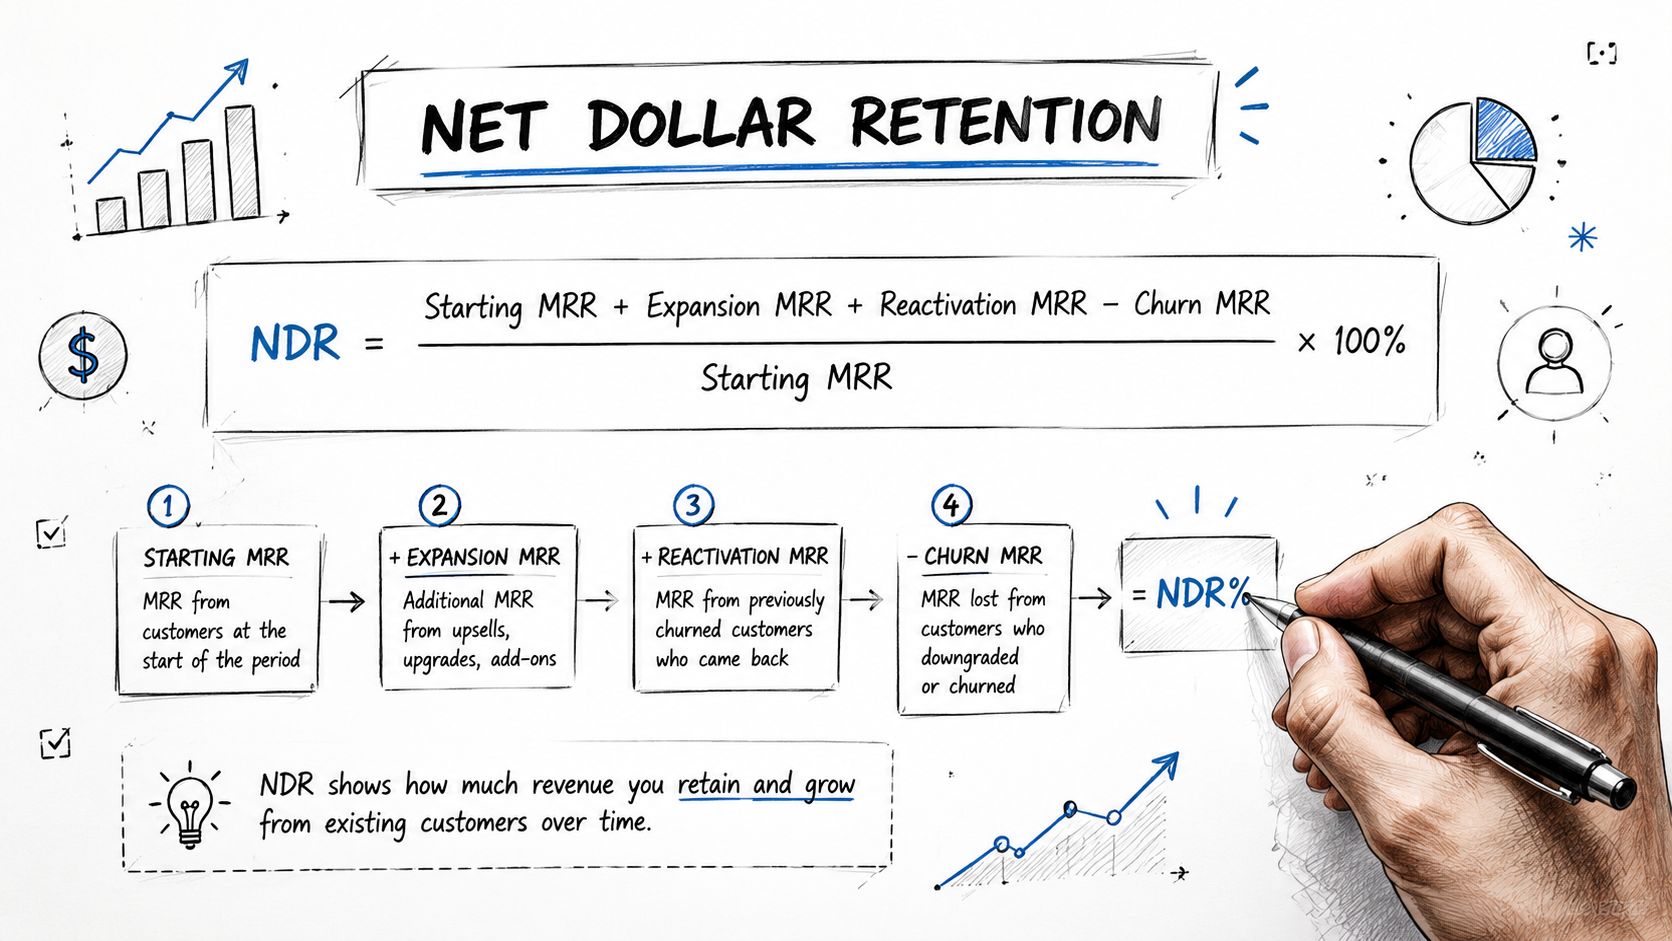
The technical formula is NDR = (Starting MRR + Expansion MRR - Contraction MRR - Churned MRR) / Starting MRR, and the critical rule is that the starting figure must exclude revenue from customers acquired during the measurement period, as outlined in this net dollar retention formula guide.
Use one fixed customer cohort
The first discipline is cohort integrity. Choose the customers who existed at the start of the month, quarter, or year. Then track what happened to their revenue only.
New logos do not belong in the calculation. If you include them, you're no longer measuring retention. You're measuring blended growth, which makes the metric far less useful.
That same rigor applies to definitions. Contraction should include downgrades and reduced spend. Churn should include revenue that fully leaves the base. Involuntary churn from failed payments needs to be classified accurately if it hasn't been recovered by period end.
A practical calculation workflow
Use a simple process and keep it consistent.
- Freeze the starting cohort. Pull all customers with active recurring revenue at the start of the period.
- Capture expansion from that cohort. Include upgrades, added seats, and other recurring increases from those same accounts.
- Subtract contraction. Any downgrade or partial revenue loss belongs here.
- Subtract churn. Remove revenue from accounts that canceled, failed renewal, or otherwise left the recurring base.
- Divide by starting revenue. That gives you net dollar retention for the cohort.
Here's a fictional example using SyncUp.
| Revenue movement | How to treat it in NDR |
|---|---|
| Existing customer upgrades plan | Add to expansion |
| Existing customer removes seats | Count as contraction |
| Existing customer cancels fully | Count as churn |
| Brand-new customer signs this month | Exclude from NDR cohort |
This looks basic, but most reporting errors come from one of three places: new customer revenue leaking into the cohort, downgrades getting ignored, or failed-payment accounts being treated as active for too long.
For teams cleaning up retention reporting, a separate review of how churn rate formulas break when definitions drift usually surfaces the same root issue.
Monthly versus annual views
Both views are useful. They answer different questions.
- MRR-based NDR gives operators a faster read on what changed recently. It's useful for spotting churn spikes, downgrade patterns, or billing issues quickly.
- ARR-based NDR is better for strategic planning because it smooths out short-term noise from billing timing or usage fluctuation.
If your product has mixed billing states, be careful. A paused subscription, a recovered failed payment, and a downgrade are not interchangeable events. The cleaner your event taxonomy, the more trustworthy your NDR becomes.
NDR Benchmarks What Is a Good Score
Public SaaS companies have historically clustered just above 100% NDR. In a Crunchbase analysis of IPO-era SaaS companies, the median net dollar retention rate was 106.5% in 2012 and about 104.0% more recently.
That shift matters for operators because it changes how aggressive your target should be. A company with 104% NDR is still growing its existing revenue base, but it has less margin for error than a business running at 110% or higher. If expansion slows for one quarter, weak churn controls and avoidable contraction show up fast.
Why company size changes the target
Stage and scale shape what "good" looks like more than generic internet benchmarks do. ChartMogul's Benchmarks report found that top-quartile SaaS companies at $1 million to $3 million ARR posted 94% net revenue retention, while top-quartile companies at $3 million to $15 million ARR posted 99%.
That is a useful reality check. Earlier-stage SaaS companies usually have less structured expansion revenue, more concentrated customer risk, and noisier billing behavior. A 98% NDR can signal a real retention problem in one business and solid operating discipline in another.
Here's the benchmark view in one table.
| Company ARR | Top Quartile NDR |
|---|---|
| $1M to $3M ARR | 94% |
| $3M to $15M ARR | 99% |
Use those numbers as calibration, then diagnose the parts of the formula.
- Below 100% means the cohort is losing revenue. The work is usually in churn prevention, contraction control, or failed-payment recovery.
- Around 100% means expansion is covering losses, but only barely. Teams in this range should examine downgrade triggers, cancellation reasons, and involuntary churn before they chase bigger upsell programs.
- Well above 100% usually means the product has expansion capacity through seats, usage, add-ons, or pricing power. It can also hide leakage if a few large accounts are carrying the metric.
The practical question is not whether your score clears a generic bar. It is which lever moves it fastest. If churn is the drag, intelligent cancellation flows and save offers can preserve revenue that would have left. If contraction is the issue, pricing and packaging often need work before sales enablement does. If involuntary churn is inflating the problem, automated dunning and payment recovery can raise NDR without adding a single new customer.
Common Measurement Pitfalls and Blind Spots
An NDR above 100% can still mask a retention problem.
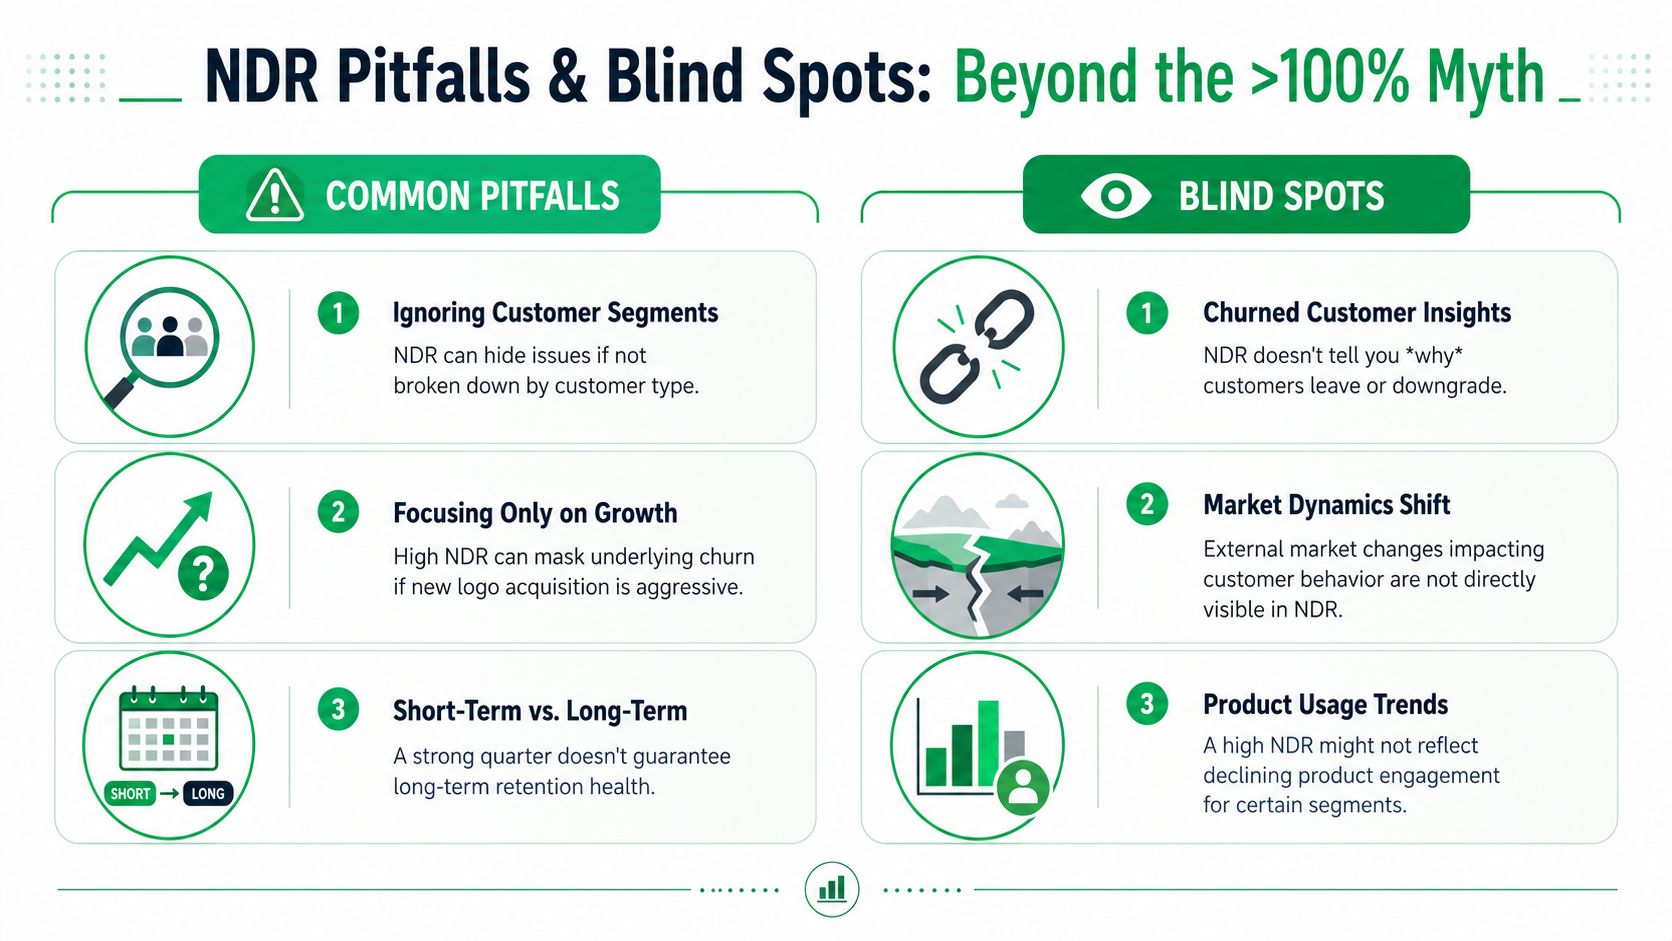
When a healthy NDR hides unhealthy retention
I see this in SaaS companies that have one strong expansion motion and weak account durability underneath it. A handful of larger customers add seats, expand usage, or buy add-ons. The top-line NDR looks healthy. At the same time, smaller accounts cancel more often, downgrade earlier, or slip into failed-payment churn.
That pattern matters because NDR is a blended output. It does not show whether revenue stayed because customers got more value, because a few accounts expanded aggressively, or because billing recovery pulled some accounts back from involuntary churn. Wall Street Prep's overview of NDR is a useful reference for the formula, but operators need a more granular view than the headline percentage.
The fix is operational, not cosmetic.
- Segment NDR by revenue cohort. Break it out by plan, ACV band, acquisition source, geography, and customer age.
- Track gross retention in parallel. That separates base retention quality from expansion strength.
- Attach revenue to churn reasons. “Too expensive” from a low-ARPU self-serve segment is a different problem than the same reason from enterprise accounts.
- Measure concentration risk. If a small number of accounts drive expansion, the metric is less stable than it appears.
A strong NDR paired with weak gross retention should trigger investigation, not celebration.
Billing states make attribution messy
Subscription revenue does not move in a straight line from active to churned. Customers pause. They downgrade. Cards fail, then get updated days later. Some accounts enter cancellation flows and accept a save offer. Others lapse because dunning logic is weak, not because product value disappeared.
If those states are collapsed into one retention number, teams make bad decisions. They may credit Customer Success for saving revenue that came back through payment recovery. They may undercount contraction because “active logos” stayed flat. They may miss that a pause option is preserving short-term MRR while signaling future churn risk.
Modern retention tooling changes the quality of measurement. Intelligent cancellation flows help separate true churn intent from saveable cases. Automated payment recovery systems show how much revenue was preserved through retries, reminders, and card updates. If you want a concrete example of the billing side, this guide on why issuer declines happen and how recovery workflows reduce revenue loss gets into the mechanics.
A few rules keep reporting honest:
- Report pauses separately from retained accounts. A pause is a save path, not proof of healthy product adoption.
- Separate voluntary churn from involuntary churn. Those require different interventions and different owners.
- Track downgrades as contraction, not customer success. The logo stayed, but revenue quality fell.
- Attribute recovered revenue clearly. Payment recovery, cancellation deflection, and natural renewal are different motions.
NDR should be the summary metric. The operating model behind it needs more detail.
Actionable Strategies to Improve Your NDR
Companies improve net dollar retention by treating it like an operating system, not a score. Every gain comes from one of three places: less churn, less contraction, or more expansion. Each lever has different owners, different tooling, and different failure modes.
Reduce churn before the cancellation posts
Revenue rarely disappears without warning. In practice, churn starts earlier, with weak adoption, unresolved objections, renewal friction, or a customer heading toward the cancel page.
That is why cancellation flows matter. A generic cancel button gives you a lost account and no learning. An intelligent flow can separate customers who need a lower commitment from customers who are definitively done. If the issue is budget, offer a right-sized downgrade. If the issue is timing, test a pause. If the reason suggests the account is recoverable and high value, route it to a human conversation instead of forcing self-serve exit.
Billing failure deserves the same attention. Involuntary churn pulls down NDR just as much as a deliberate cancellation, but the fix is different. Retry logic, reminder timing, card update prompts, and escalation rules should be managed like revenue infrastructure. This guide on why cards get declined by issuers and how recovery workflows respond is a useful reference if your billing and RevOps teams need a shared view of where failed payments come from.
Limit contraction with a downgrade strategy
Contraction is where many SaaS teams leave money on the table. They accept downgrades as inevitable, book the lower MRR, and move on.
A better approach starts with the reason behind the downgrade. Over-purchased seats, temporary budget pressure, weak feature adoption, and pricing misfit do not require the same response. If a customer bought too much, guide them into a smaller package that still supports core usage. If the pressure is temporary, a short-term discount or usage reset can preserve the relationship without rewriting pricing for good. If adoption is shallow, the answer may be onboarding and product education, not a concession.
The goal is to keep the customer inside the product with a plan that matches current value. That protects current revenue and keeps future expansion on the table.
Increase expansion only after value is proven
Expansion raises NDR fastest when it follows customer behavior. It underperforms when it is pushed from a forecast.
The best signals are usually visible in product and account data. Seat pressure. Repeated limits. Adoption of a second workflow. New teams entering the account. Support requests that point to a higher-tier need. Those moments justify an upsell because the customer is already trying to do something the current package no longer supports.
A few operating rules help:
- Trigger expansion from behavior. Usage and plan-fit signals beat broad promotional campaigns.
- Tie the offer to an active use case. Customers buy more readily when the upgrade solves the problem they are dealing with now.
- Coordinate across teams. Sales, success, and support should reinforce the same reason to expand, not send mixed messages.
- Protect new expansion from quick reversal. If an upsell happens before adoption is stable, contraction often follows a quarter later.
Founders feel this trade-off acutely. Push too early and you create fragile revenue. Wait until value is obvious and expansion rates improve, even if the deal lands later.
Measure the save path, not just the final outcome
NDR improves faster when teams know which intervention preserved revenue and which one only delayed loss. That requires path-level measurement.
Track the performance of each save motion separately. A pause is different from a downgrade. A recovered failed payment is different from a customer who renewed cleanly. A human rescue on an enterprise account should not be evaluated the same way as an automated self-serve save on a small account.
Use reporting that answers questions like these:
| Intervention | What you want to learn |
|---|---|
| Pause offer | Which segments return to full-price service, and how often does a pause turn into churn later? |
| Downgrade path | Which lower-tier options preserve product habit without creating long-term revenue shrinkage? |
| Payment recovery sequence | Which retries, reminders, and card update prompts recover the most MRR? |
| Human handoff | Which account profiles justify a sales or success intervention before cancellation completes? |
Strong retention programs do more than preserve revenue for the month. They show whether the save held, whether the account expanded later, and whether the intervention was worth the cost.
That is the practical standard for improving NDR. Reduce preventable churn with better cancellation and billing recovery systems. Contain contraction with structured downgrade paths. Drive expansion from demonstrated value. Then measure each motion tightly enough to know what changed the metric.
Conclusion Turning a Metric Into a Growth Flywheel
Net dollar retention is one of the clearest measures of whether a SaaS company is building durable revenue or constantly replacing what leaks out.
The headline percentage matters, but the operating discipline underneath matters more. Strong teams calculate it cleanly, benchmark it in context, and then manage each lever with intent. They treat churn, contraction, expansion, pauses, downgrades, and payment recovery as distinct motions with different fixes.
That's the shift that changes NDR from a board-slide metric into a growth system.
If you run SaaS revenue, the useful question isn't “What's our NDR?” It's “Which customer states are pulling it down, which interventions are lifting it, and which of those gains will last?” Teams that can answer that clearly usually make better product decisions, better pricing decisions, and better retention investments.
For a closer look at tooling built around cancellation flows, billing recovery, and retained MRR attribution, visit Revcover.
If you want to turn cancellation intent, failed payments, and downgrade pressure into measurable retained revenue, Revcover is built for that job. It connects with Stripe, routes customers into smarter save paths, coordinates payment recovery, and shows which interventions preserved MRR so your team can improve net dollar retention with evidence instead of guesswork.
Prepared with Outrank