The Churn Rate Calculation Formula: A Practical Guide
Ayush Soni
Founder, Revcover
On this page
- Introduction Why Your Churn Number Might Be Wrong
- The hidden problem is usually definition drift
- Bad churn math creates bad operating decisions
- The Foundational Formula Calculating Customer Churn Rate
- Why the denominator matters
- A simple way to think about it
- Customer Churn vs Revenue Churn What Are You Really Losing
- Why customer counts can hide the real problem
- A practical comparison
- Where net revenue churn fits
- Practical Calculation From Spreadsheets to SQL
- A spreadsheet model that works
- A SQL pattern for automation
- What to validate before trusting the output
- Navigating the Nuances Common Pitfalls and Edge Cases
- When period math gets messy
- How to handle mixed churn types
- From Measurement to Action Attributing Recovered Revenue
- What useful churn instrumentation looks like
- Why attribution changes decision making
- Frequently Asked Churn Questions
- What's a good churn rate
- Should I use one churn metric or several
- Should free trials be included
- Does cohort analysis matter
A CEO asks for last month's churn rate. Finance gives one number. Product gives another. Growth says both are misleading because they include downgrades differently. Nobody's wrong, exactly. They're just using different definitions.
That's the problem with churn. Leaders often ask for “the churn number” as if it's a single, clean metric. In practice, the churn rate calculation formula only works if you define what was lost, over what period, and against which baseline. If you get any of those wrong, you'll make the wrong call on pricing, retention, lifecycle messaging, and even hiring.
I've seen this happen most often when a team mixes cancellation counts with revenue loss, or when they alter the denominator by including new signups in the same period. The report looks better. The business usually isn't.
The fix isn't more dashboards. It's tighter metric discipline. You need one customer churn definition, one revenue churn definition, a documented reporting cadence, and enough operational detail to trace a churn event back to a real workflow. That's where churn stops being an abstract KPI and starts becoming a useful operating metric.

Introduction Why Your Churn Number Might Be Wrong
Most churn reporting breaks before anyone touches SQL. The break happens in the meeting where one person says “churn” and three people hear three different things.
A Head of Growth might mean customer cancellations. A finance lead might mean lost MRR. A product team might include voluntary cancels but exclude failed payments because billing handles those separately. Then the board deck collapses all of it into one trend line and asks why retention work isn't improving fast enough.
The hidden problem is usually definition drift
Churn becomes unreliable when teams change one of these inputs without saying so:
- What counts as loss: customer logo loss, subscription cancellation, downgrade, failed payment, or some combination.
- What period is measured: monthly, quarterly, annual, or trailing averages.
- What baseline is used: start-of-period customers, midpoint customers, or revenue at the start of the period.
- When the event is recorded: cancellation request date, subscription end date, or payment failure date.
If those rules move around, the metric stops being comparable.
Practical rule: If you can't write the churn definition in one sentence and hand it to Finance, Growth, and Product without disagreement, the number isn't ready for executive use.
Bad churn math creates bad operating decisions
This isn't academic. A weak churn definition leads teams to over-credit acquisition, underfund billing recovery, or miss the fact that a small number of account losses are driving a disproportionate share of revenue leakage.
That's why the churn rate calculation formula needs two jobs. First, it has to describe loss consistently. Second, it has to support action. You should be able to segment it by plan, reason, billing state, and customer value. Otherwise, you're just describing damage after it happens.
The rest of the article gets practical. We'll pin down the standard formula, separate customer churn from revenue churn, walk through spreadsheet and SQL examples, and then connect the metric to retention workflows that recover revenue.
The Foundational Formula Calculating Customer Churn Rate
The standard customer churn rate calculation formula is:
Lost Customers ÷ Customers at the Start of the Period × 100
That start-of-period denominator isn't optional. Stripe's churn rate guide explains why: adding mid-period acquisitions distorts the exit rate and makes retention risk look lower than it is. The same guide gives a simple example. If a company starts January with 500 customers and ends with 450, it lost 50 customers, which means a 10% churn rate.
Why the denominator matters
Teams get into trouble when they use ending customers, average customers, or total customers touched during the month without a clear reason. For a basic customer churn view, the right question is straightforward: of the customers you had at the beginning, how many did you lose?
That's why the denominator needs to stay fixed.
Think of it as a leaky bucket. You're not measuring how much water entered the bucket during the month. You're measuring how much of the original water leaked out. If you keep pouring in more water while you're trying to measure leaks, you'll understate the problem.
A simple way to think about it
Use this sequence:
- Freeze the starting base. Count active paying customers at the start of the period.
- Count losses from that base. Identify customers who churned during the period.
- Divide losses by the starting base.
- Multiply by 100 if you want the percentage format.
A compact version looks like this:
| Metric | Definition |
|---|---|
| Starting customers | Active customers at the beginning of the reporting period |
| Lost customers | Customers from that starting base who canceled during the period |
| Customer churn rate | Lost customers ÷ starting customers × 100 |
The formula is simple on purpose. That simplicity is useful because it gives teams a stable reference point month over month.
A churn metric should be boring before it becomes insightful. If the base math moves around every month, the trend line won't teach you anything.
Customer churn is also the fastest way to answer operational questions like these:
- Did cancellation volume rise?
- Are save flows changing customer behavior?
- Did a pricing or packaging change create more exits from a specific plan?
What it won't tell you is whether the revenue impact is small or severe. That's where customer-count churn stops being enough.
Customer Churn vs Revenue Churn What Are You Really Losing
A customer churn metric treats every account as equal. In a real SaaS business, they rarely are.
If you lose one small self-serve customer and one large contract customer, customer churn counts those as two exits. The business doesn't feel them equally. That's why revenue churn needs its own calculation.
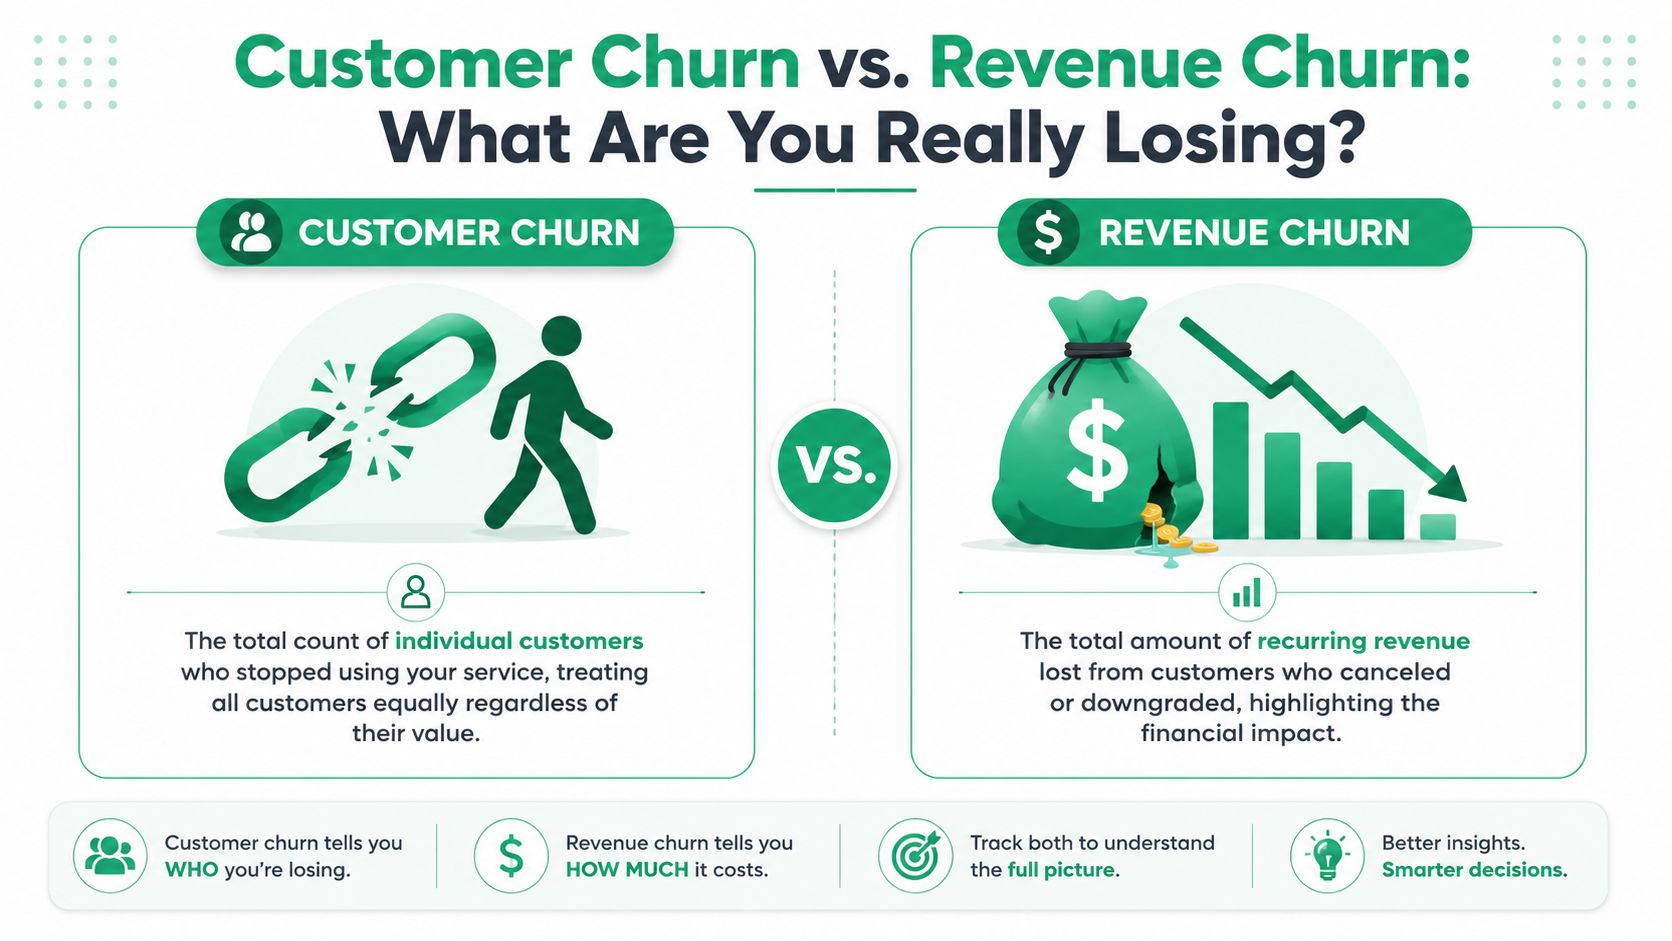
Why customer counts can hide the real problem
Revenue churn rate is calculated as:
Revenue lost to churn ÷ Total MRR in the period × 100
Recurly's explanation of churn calculation makes the distinction clearly and gives a concrete example: $5,000 lost on $100,000 MRR = 5%. The same source also notes that a small number of high-ARR losses can produce low customer churn but much higher revenue churn.
That's the operating reality many teams miss. The logo count can look manageable while the MRR loss says you have a pricing, segmentation, or account-value problem.
A practical comparison
Use customer churn when you want to understand account exits. Use revenue churn when you want to understand the financial impact of those exits.
| Metric | Best for answering | Blind spot |
|---|---|---|
| Customer churn | How many customers left? | Ignores account value differences |
| Gross revenue churn | How much recurring revenue did cancellations and downgrades remove? | Doesn't account for expansion from retained customers |
| Net revenue churn | Are retained accounts expanding enough to offset losses? | Can look healthy while underlying logo retention is weak |
A good operating review usually needs both. Customer churn helps Growth and Product see volume patterns. Revenue churn helps Finance and RevOps see where retention work matters most.
Later in the workflow, a video explanation can help teams align on language before they argue over dashboards.
Where net revenue churn fits
Gross revenue churn looks only at revenue lost. Net revenue churn goes further by considering whether expansion from existing customers offsets some or all of that loss. For SaaS companies with upgrades, seat growth, and plan expansion, this matters a lot.
The catch is practical. Net revenue churn is powerful, but it can hide problems if teams use it as the only retention metric. A business can post healthy net revenue behavior while still losing a concerning number of customers. That's why strong operators keep customer churn, gross revenue churn, and net revenue churn separate in reporting.
If your customer churn says one thing and your revenue churn says another, don't pick the prettier metric. Investigate the account mix.
Practical Calculation From Spreadsheets to SQL
The fastest way to make churn useful is to calculate it the same way everywhere. That usually starts in a spreadsheet and graduates to SQL once the rules are stable.
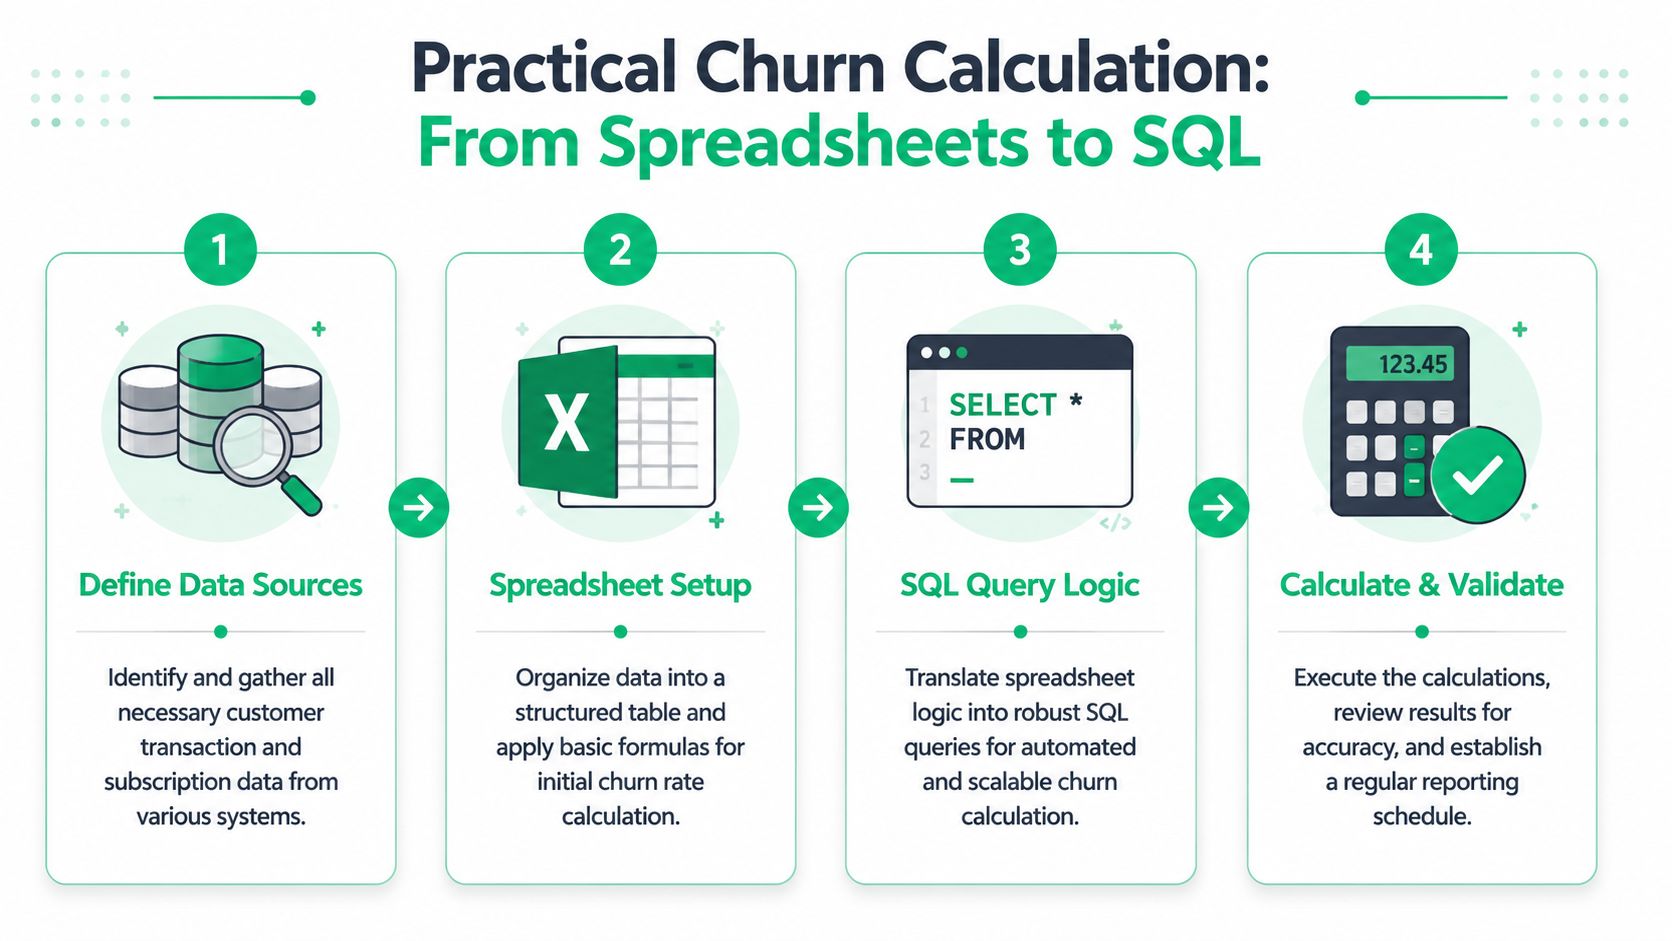
A spreadsheet model that works
For a spreadsheet model, keep it painfully simple. One tab for the monthly snapshot. One row per month. Separate customer churn from revenue churn.
Chargebee's churn glossary uses the standard baseline approach and gives two practical reference points. If a company starts a month with 1,000 customers and loses 50, the churn rate is 5%. The same logic applies on the revenue side, where $5,000 lost out of $100,000 MRR is 5% gross revenue churn.
A clean sheet might use columns like these:
| Month | Start Customers | Lost Customers | Customer Churn Rate | Start MRR | Lost MRR | Gross Revenue Churn |
|---|---|---|---|---|---|---|
| Jan | input | input | =Lost/Start |
input | input | =LostMRR/StartMRR |
A few spreadsheet rules matter more than fancy formulas:
- Lock the starting snapshot: Don't let a live export rewrite last month's starting customer count.
- Separate cancellations from downgrades: They affect different metrics and different teams.
- Store the event date you report on: Request date and effective end date are not the same thing.
- Keep reactivations out of churn loss rows: Track them separately so you don't muddy the exit metric.
If you're still debating definitions, don't automate yet. A bad spreadsheet copied into SQL becomes a faster bad report.
A SQL pattern for automation
Once the logic is stable, SQL should mirror the spreadsheet. Keep the model transparent enough that Finance can audit it.
Here's a simple pattern using a subscriptions table with customer_id, status, mrr, started_at, and ended_at.
WITH month_start AS (
  SELECT
    customer_id,
    mrr
  FROM subscriptions
  WHERE started_at < DATE_TRUNC('month', CURRENT_DATE)
    AND (ended_at IS NULL OR ended_at >= DATE_TRUNC('month', CURRENT_DATE))
),
month_churn AS (
  SELECT
    customer_id,
    mrr
  FROM subscriptions
  WHERE ended_at >= DATE_TRUNC('month', CURRENT_DATE)
    AND ended_at < DATE_TRUNC('month', CURRENT_DATE) + INTERVAL '1 month'
),
customer_metrics AS (
  SELECT
    (SELECT COUNT(*) FROM month_start) AS start_customers,
    (SELECT COUNT(*) FROM month_churn) AS lost_customers
),
revenue_metrics AS (
  SELECT
    COALESCE((SELECT SUM(mrr) FROM month_start), 0) AS start_mrr,
    COALESCE((SELECT SUM(mrr) FROM month_churn), 0) AS lost_mrr
)
SELECT
  start_customers,
  lost_customers,
  CASE
    WHEN start_customers = 0 THEN NULL
    ELSE lost_customers::decimal / start_customers
  END AS customer_churn_rate,
  start_mrr,
  lost_mrr,
  CASE
    WHEN start_mrr = 0 THEN NULL
    ELSE lost_mrr::decimal / start_mrr
  END AS gross_revenue_churn_rate
FROM customer_metrics, revenue_metrics;
This query is intentionally plain. In production, organizations typically add filters for active paid subscriptions, exclude trial states, and separate cancellation events from payment-failure churn.
What to validate before trusting the output
Run three checks before anyone uses the dashboard:
- Spot-check individual accounts: Make sure known cancellations appear in the churn set.
- Reconcile to billing exports: The SQL should align with your system of record.
- Validate one closed month manually: If the SQL and spreadsheet disagree, fix the logic before scaling it.
That discipline is what turns a churn rate calculation formula into an operating metric instead of another chart everyone argues about.
Navigating the Nuances Common Pitfalls and Edge Cases
Real churn reporting gets messy fast. Annual plans renew on different cycles. Failed payments create involuntary churn. Downgrades reduce MRR without removing the logo. Reactivations blur the line between retention and reacquisition.
The right response isn't to invent a more complicated master metric. It's to define separate treatments for separate events.
When period math gets messy
A common mistake is calculating one annual churn number directly from a fast-changing customer base and then comparing it to monthly numbers as if they mean the same thing. Stripe's discussion of average churn rate notes that teams often calculate churn by period and then average across multiple periods, such as computing monthly churn for each of 12 months and dividing by 12. The same explanation also notes that when the customer base changes quickly, some teams use the midpoint of the customer count for the month as an adjusted denominator.
That's useful in practice when growth is rapid enough that a strict start-of-month base understates the shape of churn. But it's only useful if you label it clearly. Don't mix midpoint-denominator churn with standard start-of-period churn in the same trend without explaining the difference.
How to handle mixed churn types
The cleanest operating model is to split losses into categories and report each one on purpose.
- Voluntary cancellations: customer chose to leave.
- Involuntary churn: billing failed and the subscription lapsed.
- Downgrades: customer stayed, revenue dropped.
- Expansions: customer stayed, revenue increased.
- Reactivations: previously churned customer returned.
Those categories answer different questions. Product teams care about cancellation reasons. Billing and lifecycle teams care about failed payment recovery. Finance cares whether downgrades are subtly eroding MRR even when logo retention looks acceptable.
Your reporting should reflect customer behavior, not force every event into a single “churn” bucket.
A few edge-case rules help keep things clean:
- For annual contracts, decide whether churn is recorded at cancellation intent or at term end. Document it once and stick to it.
- For downgrades, keep them out of customer churn and in revenue churn.
- For reactivations, don't net them against churn in the same line item. Report them separately.
- For failed payments, decide whether to count them only after recovery attempts are exhausted.
Messy billing realities don't invalidate churn metrics. They just require better taxonomy.
From Measurement to Action Attributing Recovered Revenue
A churn metric earns its place when it changes behavior. If your dashboard can tell you who left but not what intervention prevented a similar loss yesterday, it's incomplete.
The practical shift is to instrument churn at the point of intent, not just after the subscription is gone.
What useful churn instrumentation looks like
Useful retention systems capture more than a cancellation event. They record the reason selected, the plan, the account value, the billing state, and the path shown to the customer next.
That matters because not every at-risk customer should see the same flow. A user asking for a temporary pause should get a different path than one leaving over missing functionality. A customer in failed-payment status needs a recovery path, not a discount.
Teams usually make better decisions when they can tie churn handling to outcomes such as:
- Accepted save offers
- Recovered recurring revenue
- Downgrade instead of cancellation
- Payment recovery after failed charge
- Reason themes by revenue impact
Why attribution changes decision making
Once you can attribute recovered MRR to a specific intervention, the retention conversation gets sharper. Instead of debating whether “the cancel page helped,” you can ask which offer, for which segment, under which conditions produced the best result.
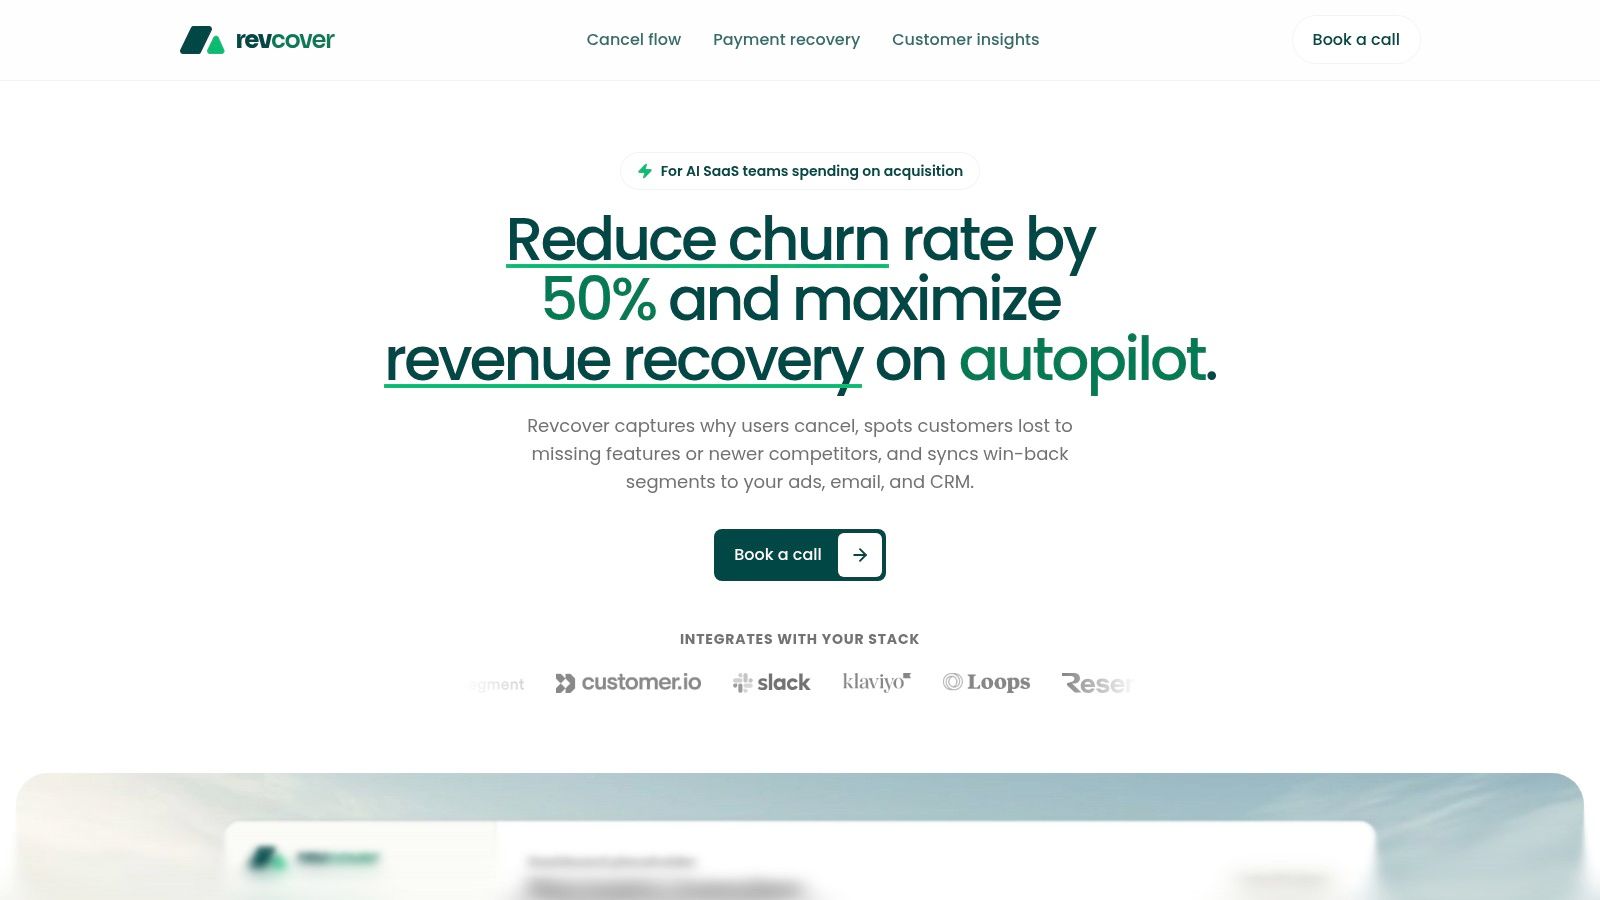
That's the gap many teams are trying to close with tools built around cancellation orchestration and billing recovery. Platforms like Revcover focus on connecting churn intent, save paths, payment recovery, and revenue attribution into one operating loop.
The strongest retention programs don't stop at measuring churn. They trace each save action to a financial outcome.
That's the difference between passive reporting and active recovery. One tells you what happened. The other gives you a repeatable way to influence what happens next month.
Frequently Asked Churn Questions
What's a good churn rate
There isn't one universal answer. A healthy number depends on pricing model, contract length, customer segment, and whether you're looking at customer churn or revenue churn. A benchmark without context usually creates more noise than insight.
Should I use one churn metric or several
Use several. Wall Street Prep's discussion of churn rate highlights an issue many SaaS teams run into: mixed churn types such as voluntary cancellations, involuntary churn from failed payments, downgrades, and expansions can make a single customer-count formula hide important revenue leakage. In practice, that means you usually need separate views for customer churn, gross revenue churn, and net revenue churn.
Should free trials be included
For most primary retention reporting, no. Trial conversion is a different question from paid customer retention. Keep those metrics separate so you don't muddy the signal.
Does cohort analysis matter
Yes. Aggregate churn tells you what happened in a period. Cohort analysis tells you when and where customers tend to leave across their lifecycle. That's often where product, onboarding, and pricing problems become easier to spot.
If you want to turn churn reporting into a recovery system, Revcover is built for that job. It connects to Stripe, captures cancellation intent in-product, routes customers into customized save paths, coordinates payment recovery, and attributes outcomes to recovered recurring revenue so your team can see which retention actions are working.