
Subscription Business Metrics: Drive Growth & Profit

Ayush Soni
Founder, Revcover

On this page
- Why Your Dashboard Might Be Lying to You
- The problem with top-line comfort
- What a useful metric system looks like
- Foundational Growth Metrics MRR ARR and ARPA
- MRR is the operating heartbeat
- ARR gives leadership a planning metric
- ARPA shows whether growth is getting stronger
- Understanding and Reducing Customer Churn
- Not all churn means the same thing
- Strategic churn is sometimes the right answer
- Reduction starts with diagnosis not slogans
- Beyond Churn with NRR and Cohort Analysis
- NRR is the health score that changes board conversations
- Cohorts show where retention actually breaks
- Balancing LTV and CAC for Profitability
- LTV and CAC answer the efficiency question
- The ratio matters less than the diagnosis
- Segment before making budget decisions
- Add payback period before calling the model healthy
- From Measurement to Action Levers and Experiments
- Match the lever to the failure mode
- Build experiments that can survive scrutiny
- Building Your Subscription Intelligence Loop
You log into your dashboard, see MRR moving up, and still feel uneasy. Sales says pipeline is fine. Product says usage looks healthy. Finance sees recurring revenue and wants the forecast. But if renewals feel soft, cancellations are piling up in support tickets, or paid acquisition keeps getting more expensive, top-line growth can hide a weak core.
That's the trap with subscription business metrics. Teams often track too many numbers and ask too few business questions. The useful way to read a subscription business isn't metric by metric. It's question by question. How fast are we growing? Are customers staying? Is that growth efficient enough to keep compounding?
The strongest operators I've worked with don't treat metrics as a reporting exercise. They treat them as an operating system. Each metric should point to a decision, a lever, or an experiment. If it doesn't, it belongs in a reference dashboard, not in the weekly growth review.
Why Your Dashboard Might Be Lying to You
A dashboard lies when it answers the wrong question well. MRR can rise while retention weakens. Net new revenue can look solid while expansions slow, discounts increase, and support burden climbs on low-fit accounts. You end up celebrating motion instead of health.
The usual culprit is aggregation. A single headline number blends together new sales, expansion, downgrades, cancellations, failed payments, and pricing changes. That hides cause and effect. It also creates bad decision-making. Teams push harder on acquisition because growth looks fine, when the actual fix is in onboarding, packaging, billing recovery, or cancel flow design.
The problem with top-line comfort
When leaders look only at top-line recurring revenue, they miss the mechanics underneath it. A healthy subscription business should answer three separate questions:
- Growth: Is recurring revenue expanding at a pace that supports the plan?
- Retention: Are customers and dollars staying long enough to create compounding value?
- Efficiency: Are we buying growth at a cost structure that makes the model durable?
That's why I prefer metrics grouped by decision, not by finance glossary. It's the same mindset you'd use in a clean revenue attribution model for recurring growth. Don't just ask where revenue appeared. Ask what created it, what threatened it, and which team can influence it next.
Practical rule: If a metric can't tell a team what to change this week, it's not a core operating metric.
What a useful metric system looks like
A useful subscription business metrics stack has a simple job. It should separate signal from noise.
| Business question | Core metric family | What it should trigger |
|---|---|---|
| Are we growing? | MRR, ARR, ARPA | Pricing, packaging, expansion, acquisition decisions |
| Are customers staying? | Churn, NRR, cohorts | Onboarding fixes, save offers, billing recovery, product retention work |
| Is growth sustainable? | LTV, CAC, LTV:CAC | Channel mix, payback discipline, go-to-market pacing |
If your current dashboard can't support that level of action, it isn't giving you visibility. It's giving you reassurance.
Foundational Growth Metrics MRR ARR and ARPA
A revenue chart can look healthy and still point the team toward the wrong decisions. I have seen companies celebrate MRR growth while discounts eroded ARPA, or forecast ARR off one-time spikes that never repeated. If the foundation is sloppy, every growth conversation gets distorted.
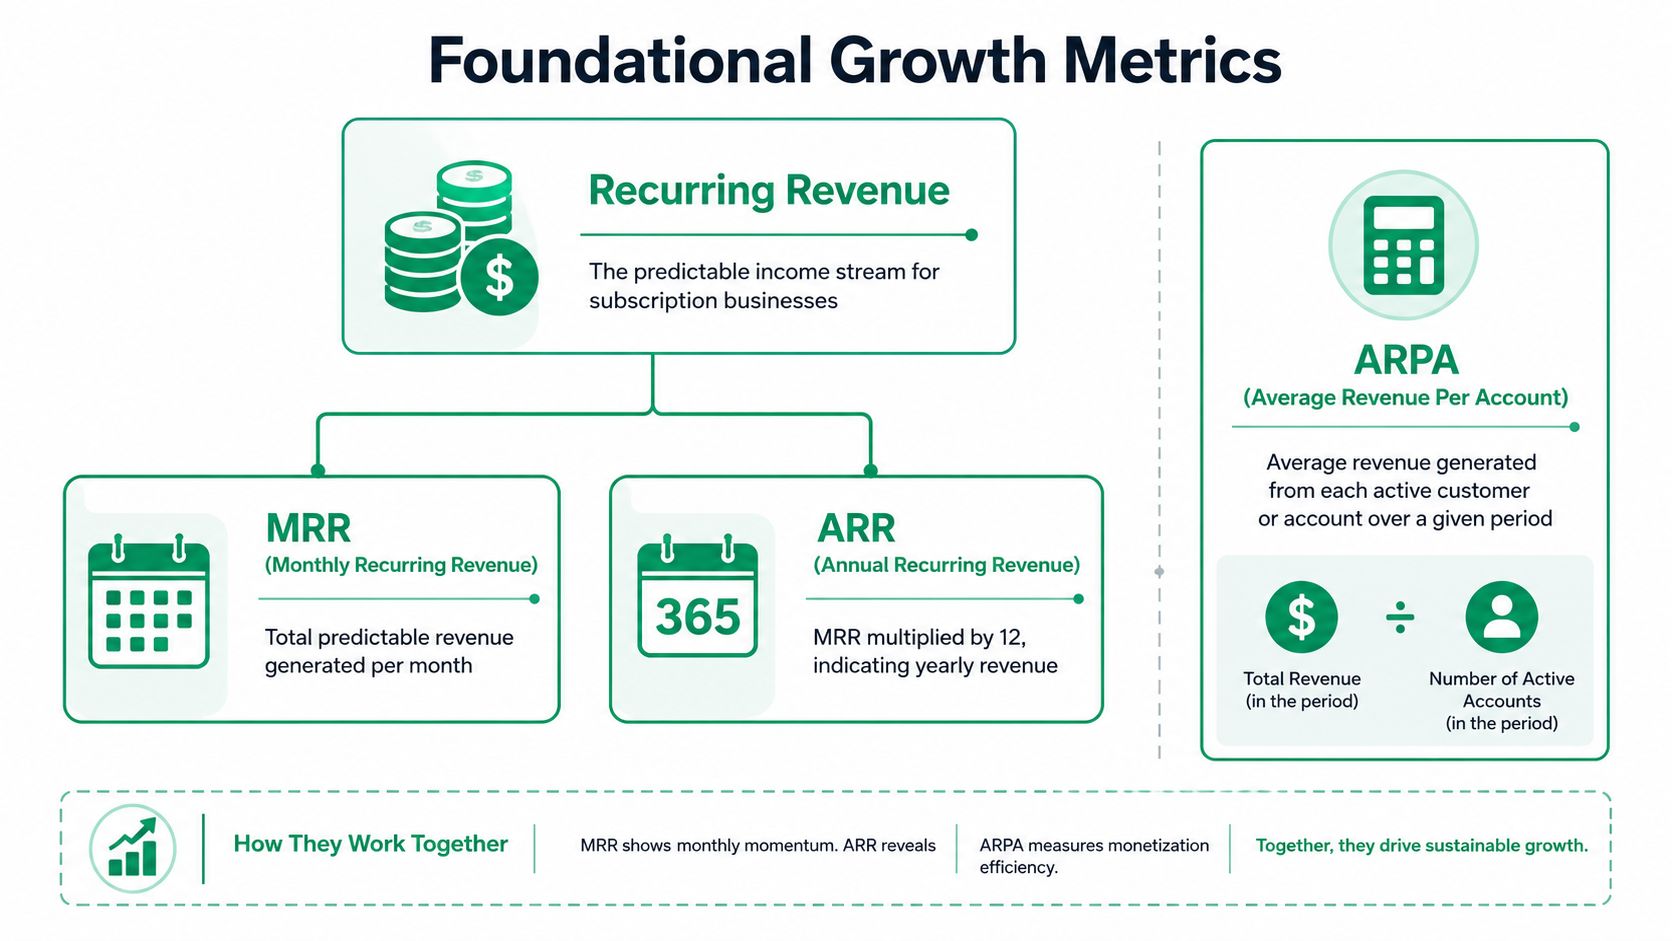
These three metrics answer different growth questions:
- MRR: Are we adding recurring revenue this month?
- ARR: What annual run rate are we building toward?
- ARPA: Are accounts becoming more valuable over time?
Used together, they help teams separate topline growth from growth quality.
MRR is the operating heartbeat
Monthly Recurring Revenue (MRR) is the recurring subscription revenue generated from active customers in a given month. The basic formula is:
MRR = Active paying accounts × average monthly subscription revenue
Earlier, Younium's subscription metrics guide gave a simple example. 1,000 active accounts paying $50 per month produce $50,000 in MRR. The formula is simple. The operating value comes from how you segment it.
I track MRR in four movement types:
- New MRR from newly converted customers
- Expansion MRR from upgrades, added seats, or add-ons
- Contraction MRR from downgrades
- Churned MRR from cancellations
That breakdown changes the conversation. If New MRR is strong but Expansion MRR is flat, the next question is product adoption or packaging. If Expansion is healthy but Contraction is rising, pricing pressure or seat utilization may be the issue. If Churned MRR keeps climbing, acquisition can hide the problem for a quarter, but not for long.
A single MRR number does not tell you which lever to pull. Movement categories do.
ARR gives leadership a planning metric
Annual Recurring Revenue (ARR) converts monthly run rate into a yearly planning view:
ARR = MRR × 12
ARR is useful for annual planning, headcount models, board updates, and investor conversations. It gives leadership a cleaner way to discuss scale. It is less useful for week-to-week operating control, because ARR can make short-term shifts look smaller than they are.
Use MRR to run the business. Use ARR to plan the business.
| Metric | Formula | Best use |
|---|---|---|
| MRR | Active paying accounts × average monthly subscription revenue | Monthly performance and operating review |
| ARR | MRR × 12 | Annual planning and investor reporting |
| Net new MRR | New + Expansion - Contraction - Churn | Growth quality and momentum |
One question helps keep ARR honest: if acquisition paused for one month, how much of this run rate would hold?
That is why I prefer net new MRR over gross bookings in a subscription model. Gross bookings can flatter the top line. Net new MRR shows whether recurring revenue is expanding after you account for downgrades and churn.
ARPA shows whether growth is getting stronger
Average Revenue Per Account (ARPA) measures account value across your customer base:
ARPA = Total recurring revenue ÷ active accounts
ARPA matters because growth by account count alone is expensive. Growth with rising account value is usually easier to sustain.
For teams refining pricing or packaging, a precise average revenue calculation for subscription accounts helps keep comparisons clean across plans and billing periods. The point is not mathematical complexity. The point is decision quality.
ARPA usually surfaces trade-offs faster than topline revenue does. If account count rises while ARPA falls, you may be moving down-market, discounting too heavily, or acquiring weaker-fit customers. If ARPA rises and logo growth slows, the team may be getting more efficient through better packaging or sales focus. If ARPA rises and churn rises with it, pricing may be ahead of delivered value.
That is why these three metrics belong in the same view. MRR tells you whether recurring revenue is growing. ARR tells leadership what scale that growth supports. ARPA tells you whether the customer base behind that growth is getting stronger or weaker.
Understanding and Reducing Customer Churn
If MRR is the engine, churn is the drag on the drivetrain. Churn's importance is widely recognized. Fewer can say exactly which kind of churn is hurting them, how it shows up in revenue, and which team owns the fix.
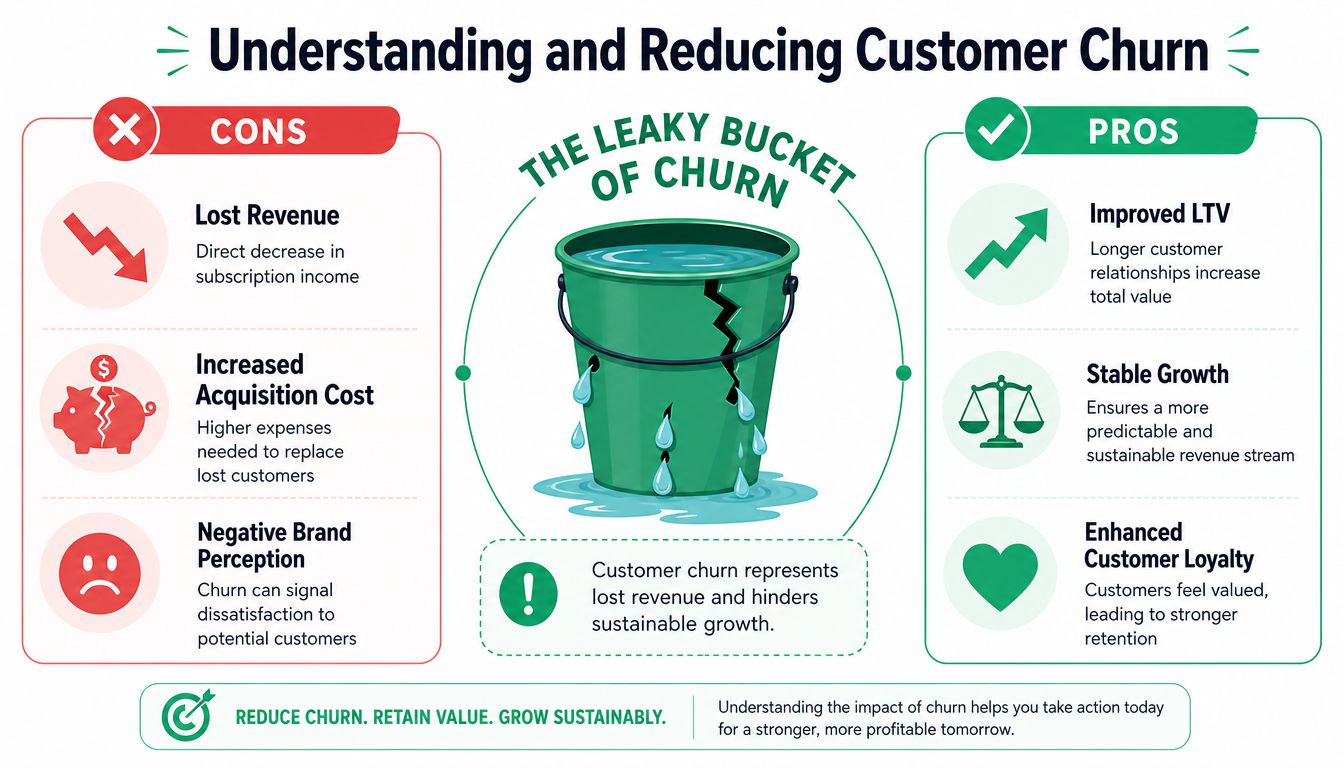
In subscription software, typical customer churn rates range between 10% and 14% annually, and for SaaS, a healthy monthly churn rate is often considered less than 5%, according to DealHub's guide to subscription metrics. Once churn rises above that zone, you get the classic leaky-bucket problem. New acquisition has to replace losses before it can create real growth.
Not all churn means the same thing
There are two distinctions that matter immediately.
First, customer churn and revenue churn are not interchangeable. Losing a handful of small self-serve accounts isn't the same as losing one large expansion-ready account. Count tells you volume. Revenue tells you impact.
Second, you need to split voluntary churn from involuntary churn.
- Voluntary churn happens when customers actively cancel because the product, value, timing, support, or fit isn't strong enough.
- Involuntary churn comes from payment failure, expired cards, failed retries, procurement friction, or billing issues.
Those two categories require different workflows. Product and customer success usually influence voluntary churn. Billing operations, payment recovery logic, and lifecycle messaging usually influence involuntary churn.
A simple working approach:
| Churn type | Typical cause | Best first lever |
|---|---|---|
| Customer churn | Users cancel | Onboarding, cancel flow, product value communication |
| Revenue churn | Dollars lost from cancellations or downgrades | Expansion strategy, account triage, save offers |
| Voluntary churn | Dissatisfaction or low need | Segmentation, retention offers, better activation |
| Involuntary churn | Failed payment | Retry logic, card update prompts, billing follow-up |
Here's a useful diagnostic resource if your team is trying to reduce churn rate in a recurring revenue model without turning every cancel event into a generic survey problem.
Later in the section, this walkthrough gives a decent visual summary of the leaky-bucket dynamic:
Strategic churn is sometimes the right answer
This is the part many churn guides skip. Not all retained customers improve the business.
Maxio's analysis of subscription health points to a more nuanced idea. Some top-performing SaaS companies have reported that removing 10% to 15% of their most problematic accounts improved overall net revenue retention by 3% to 5% because support overhead dropped and the retained base became healthier.
That doesn't mean pushing customers out casually. It means some accounts consume disproportionate support time, resist the product's core use case, or sit permanently on low-value plans while demanding high-touch service. In those cases, chasing raw logo retention can hurt profitability.
Keep customers who create durable value. Don't confuse account count with account quality.
Reduction starts with diagnosis not slogans
Teams often react to churn with broad retention projects. Better emails. More check-ins. More discount approvals. That usually spreads effort too thin.
A better sequence looks like this:
- Separate churn by reason and by revenue impact. A cancellation reason from a small account shouldn't carry the same weight as one from a large account.
- Look at tenure. Early churn usually points to onboarding, expectations, or activation. Late churn often points to value ceiling, pricing tension, or changing needs.
- Distinguish avoidable from acceptable churn. Billing failures are recoverable in a different way than low-fit customers who should leave cleanly.
- Review downgrade paths, not just cancellations. Contraction often reveals pricing and packaging friction before full churn appears.
Most churn work fails because teams talk about “retention” as a virtue. The useful question is narrower. Which failure mode is creating the loss, and what system change would prevent it next time?
Beyond Churn with NRR and Cohort Analysis
Churn tells you what leaked out. Net Revenue Retention (NRR) tells you whether the existing customer base can still grow despite that leakage. That's why it changes the quality of a leadership conversation. It moves the discussion from loss prevention to compounding.
NRR is the health score that changes board conversations
The formula is straightforward. NRR = (Starting MRR + Expansion MRR - Contraction MRR - Churned MRR) ÷ Starting MRR. Elena Verna's churn benchmarks analysis describes NRR as the definitive metric for subscription health, notes that an excellent score exceeds 120%, and explains that NRR below 100% puts the business in a negative compounding state.
That framing matters operationally.
- If NRR is above 100%, the installed base is adding enough expansion to offset losses.
- If NRR is below 100%, every growth plan gets harder because the base is shrinking before acquisition enters the picture.
- If NRR is strong but logo retention is weaker, expansion may be concentrated in a subset of accounts. That creates concentration risk.
- If logo retention is decent but NRR is soft, downgrades and contraction may be doing more damage than outright cancellations.
Board-level shortcut: Ask whether existing customers are growing the business or quietly capping it.
Cohorts show where retention actually breaks
Average churn rates flatten the story. Cohort analysis restores it.
A cohort groups customers by a shared starting point, usually signup month, activation month, plan, acquisition source, or sales segment. Then you track how each group behaves over time. This is how you catch structural retention problems that averages hide.
A few examples of what cohorts expose:
- Onboarding breakage: One signup month underperforms after a product or pricing change.
- Channel quality issues: Paid search customers churn faster than partner-sourced customers.
- Plan mismatch: A lower-tier plan converts well but retains poorly because key value is locked behind upgrades too early.
- Sales handoff friction: High-touch segments retain worse after close because expectations were overset.
Cohorts are especially useful when the team keeps debating whether the problem is product, marketing, or sales. A cohort view usually narrows that argument fast.
Look for pattern breaks, not just bad averages. If one cohort falls sharply early, fix activation. If later-period retention slips across multiple cohorts, look at product depth, pricing fit, or ongoing value delivery. If only one acquisition source is weak, that's not a retention crisis. It's a channel quality problem.
Balancing LTV and CAC for Profitability
It is possible to post strong new bookings and still make the business less healthy.
That usually shows up in a familiar operating scenario. Marketing reports efficient acquisition. Sales hits target. MRR climbs. Then finance asks a harder question: how long does it take to earn back what the company spent to acquire those customers, and do those customers stay long enough to justify the spend? That is the business question behind LTV and CAC.
LTV and CAC answer the efficiency question
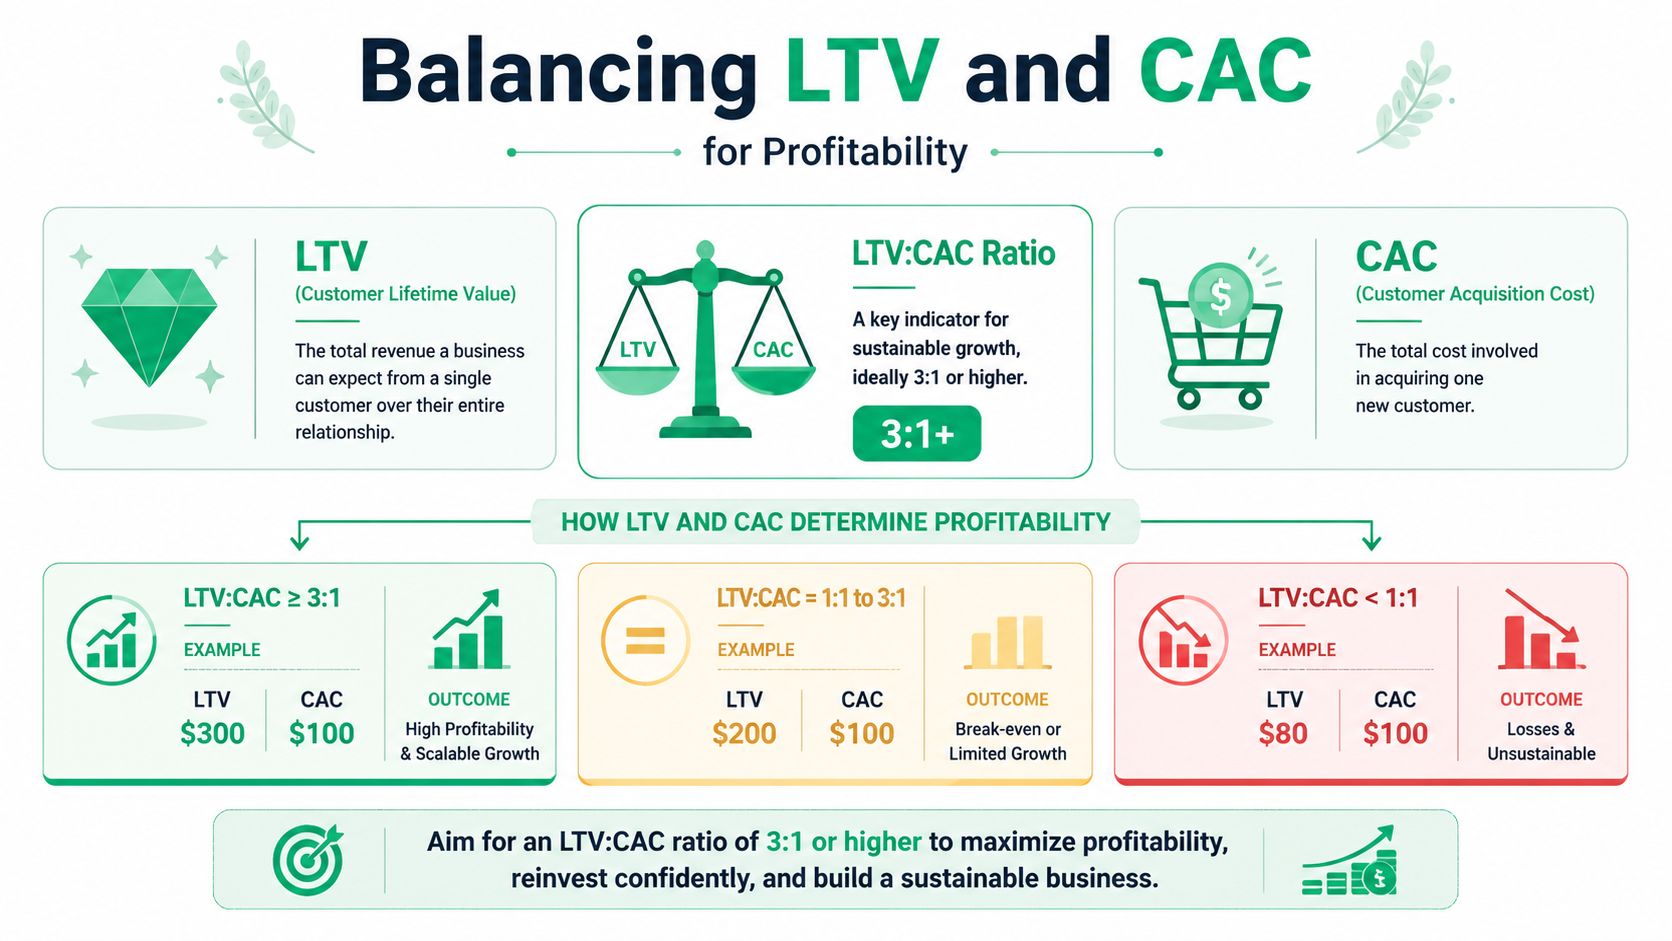
If growth metrics answer, “Are we adding revenue?”, LTV and CAC answer, “Are we buying durable revenue at a sensible cost?”
Customer Lifetime Value (LTV) estimates the value of a customer over the life of the relationship. Customer Acquisition Cost (CAC) measures the fully loaded cost to acquire that customer.
Simple formulas keep teams honest:
- CAC = total sales and marketing spend ÷ new customers acquired
- LTV = ARPA × gross margin × average customer lifetime
Some teams use revenue-based LTV. Others use gross-margin-adjusted LTV. The second is better for decision-making because it reflects what the business keeps, not just what it bills.
A widely used rule of thumb is an LTV:CAC ratio around 3:1. Treat that as a starting point, not a target to worship. A company with fast payback, strong retention, and room to invest may choose to run lower for a period. A company with weak retention or cash pressure should demand more.
The ratio matters less than the diagnosis
The number is useful because it points to the next question.
- High LTV, rising CAC: acquisition channels are getting more expensive, conversion rates are slipping, or the sales process is carrying too much cost.
- Reasonable CAC, weak LTV: the problem usually sits in retention, pricing, gross margin, or expansion.
- Weak LTV and high CAC: the business is likely attracting low-fit customers and paying too much to do it.
That framing is more useful than debating whether 2.8:1 is “good enough.” Operators need to know which system is broken.
Segment before making budget decisions
Blended LTV:CAC can hide the exact problem.
Channel mix is one reason. Paid search may bring in customers cheaply at the top of the funnel but retain poorly. Partner-sourced customers may cost more to acquire and still create better economics because they stay longer and expand faster. The same issue shows up across sales motions. Self-serve, product-led, and enterprise deals can all produce very different payback profiles.
Use the ratio by segment:
| Segment cut | What to look for | Likely action |
|---|---|---|
| Channel | CAC rising faster than retained value | Reduce spend in low-quality channels, shift budget to sources with better retention |
| Plan or package | Low-tier customers never reach healthy LTV | Rework packaging, pricing fences, or upgrade paths |
| Market or ICP | One customer type retains and expands better | Tighten targeting and qualification |
| Sales motion | Sales-led deals cost more but retain better | Accept higher CAC where expansion and contract quality justify it |
A lot of teams overspend. They see an acceptable blended CAC, keep adding budget, and miss the fact that one segment is carrying the rest.
Add payback period before calling the model healthy
LTV:CAC is a long-horizon metric. Cash leaves the business now.
That is why I never review LTV:CAC without CAC payback period. A ratio can look healthy on paper while payback takes too long for the company's cash position or growth plan.
A practical read looks like this:
| Signal | Likely issue | Better response |
|---|---|---|
| LTV:CAC looks weak | Acquisition cost is too high, or retention and expansion are too low | Cut low-fit channels, improve activation, revisit pricing and packaging |
| LTV:CAC looks healthy but cash is tight | Payback is too slow for current spend levels | Slow acquisition in long-payback segments, improve conversion efficiency, shorten sales cycles |
| Ratio varies sharply by segment | Blended reporting is hiding customer quality differences | Allocate budget and headcount by segment economics |
The strategic mistake is scaling acquisition before unit economics are proven. More spend does not fix poor retention. Better creative does not rescue a bad-fit customer. It just helps the business acquire unprofitable revenue faster.
From Measurement to Action Levers and Experiments
Most metric conversations die in dashboards. That's where operators lose the plot. The point of subscription business metrics isn't monitoring. It's intervention.
Match the lever to the failure mode
Metrics only become useful when they map to a specific system change.
If voluntary churn is rising, “improve retention” is too vague. You need a concrete lever. That might mean rewriting cancellation paths so customers can downgrade, pause, or request help instead of facing a binary stay-or-leave screen. It might mean routing high-value accounts to success or sales while letting low-fit accounts exit cleanly. It might mean changing onboarding so the first value moment arrives faster.
If involuntary churn is the issue, the right lever is different. You need payment recovery workflows, card update paths, retry sequencing, reminder timing, and billing-state handling.
A clean mapping looks like this:
- High early churn: Fix activation, trial-to-paid expectations, onboarding milestones.
- High cancellation intent after renewal date: Rework pricing communication and value reinforcement.
- Downgrades before full cancellations: Improve plan architecture and introduce a better lower-tier landing spot.
- Failed payment losses: Coordinate retries, reminders, in-app prompts, and account-state logic.
The fastest way to waste a quarter is to treat every churn problem like a messaging problem.
Build experiments that can survive scrutiny
Good teams don't just add save offers or billing nudges. They instrument them. Every change should be attributable to an outcome.
That means setting up experiments such as:
- Pause versus discount for specific account segments
- Downgrade path versus cancellation for customers citing budget pressure
- Support handoff versus self-serve exit for larger accounts
- Payment recovery message timing for failed renewal attempts
The key is to evaluate outcomes in recurring revenue terms, not just clicks or completion rates. Accepted offers, recovered MRR, downgraded-but-retained accounts, and eventual churn after intervention are more useful than generic conversion metrics.
Tools connected to Stripe become operationally valuable. Instead of rebuilding billing logic, teams can work alongside the billing source of truth and focus on experimentation, routing, recovery, and feedback analysis. The strongest systems also send alerts into Slack, sync outcomes into CRM or ad platforms, and keep churn reasons tied to revenue context so product and growth can prioritize fixes.
That operating model matters more than any single tactic. One save offer won't fix a weak retention system. Repeated experiments with clear attribution will.
Building Your Subscription Intelligence Loop
Strong subscription businesses don't run on monthly reporting rituals alone. They run on a loop. Measure the right signals. Diagnose the cause. Act with a targeted intervention. Feed the result back into the next decision.
That loop starts with MRR, ARR, and ARPA so you know what growth is made of. It sharpens with churn, NRR, and cohorts so you know whether the base is healthy or decaying. It becomes financially credible with LTV and CAC so growth doesn't outrun the model. Then it becomes operational when teams tie those metrics to specific experiments in onboarding, cancellation flow design, payment recovery, packaging, and expansion.
Most dashboards stop at visibility. Good operators build feedback systems.
If you want subscription business metrics to drive profit, not just reporting, build that loop into your weekly operating cadence. Review the metric. Name the failure mode. Assign the lever. Ship the experiment. Read the revenue outcome. Then repeat.
If you want to turn churn signals into measurable recovery work, Revcover helps subscription software teams run smarter cancellation flows, payment recovery, and revenue attribution alongside Stripe. It's built for teams that want more than a dashboard. It gives them a way to test save offers, capture churn reasons in context, and tie outcomes back to recovered MRR.