
Retention Ratio Calculation for SaaS: A Practical Guide

Ayush Soni
Founder, Revcover

On this page
- What Retention Ratio Really Measures in SaaS
- The investor definition and the operator definition
- Why the SaaS definition matters more day to day
- Customer Retention vs Revenue Retention Formulas
- Why customer retention is only the first cut
- How to think about GRR and NRR
- A Step-by-Step Worked Example with Cohorts
- Start with a clean cohort definition
- Apply the formulas in order
- Why cohorts change the conversation
- Interpreting Your Results and Avoiding Common Pitfalls
- What different retention patterns usually mean
- Mistakes that break retention ratio calculation
- Taking Action Based on Your Retention Metrics
- When voluntary churn is the problem
- When involuntary churn is the problem
- Why this becomes a growth system
- Frequently Asked Questions About Retention Calculation
- What is a good retention ratio in SaaS
- How often should you calculate retention
- When should you use customer retention vs revenue retention
If you're looking at one retention number in a dashboard and still can't answer why revenue slipped, you're not alone. Most SaaS teams start with a vague churn rate, then realize it hides the only questions that matter: which customers left, which revenue was recoverable, and which losses came from cancellations versus failed payments.
A useful retention ratio calculation does more than fill a board slide. It gives Product, Growth, Success, and RevOps a shared operating language. If the math is sloppy, every downstream decision gets sloppy too. Save offers get shown to the wrong accounts. Payment recovery gets lumped in with product churn. Expansion masks core leakage. Teams feel busy while the base erodes.
What Retention Ratio Really Measures in SaaS
The phrase retention ratio causes trouble because finance teams, investors, and SaaS operators often mean different things by it. In corporate finance, the financial retention ratio, also called the plowback ratio, is calculated as Retained Earnings / Net Income, which also equals 1 minus the Dividend Payout Ratio, and it measures how much profit a company reinvests instead of distributing to shareholders, as explained in Intrinio's breakdown of the plowback ratio.
That's a valid metric. It just isn't the one your subscription team uses to diagnose churn.
In SaaS, retention needs to answer operational questions. Are customers staying? Is recurring revenue from the starting book of business holding up? Are upgrades masking a cancellation problem? Are failed cards hurting revenue more than product dissatisfaction? Those are not finance-theory questions. They're operating-model questions.
The investor definition and the operator definition
A board member may ask about retention and mean capital allocation. A Head of Growth may ask the same question and mean customer survival by cohort. A RevOps lead may mean gross revenue retention by plan tier. If those get mixed together, reporting turns into noise.
A practical SaaS stack usually separates retention into a few layers:
- Customer retention tracks whether the original customer cohort stayed.
- Gross revenue retention tracks how much starting recurring revenue remained after churn and contraction.
- Net revenue retention adds expansion back in to show whether the existing base grew or shrank.
That distinction matters because each metric drives a different action. If you're trying to understand this split in more detail, this comparison of GRR vs NRR is a useful companion.
Practical rule: If a retention metric can't tell your team what to fix next, it's not detailed enough for a SaaS operating review.
Why the SaaS definition matters more day to day
The plowback ratio tells investors how earnings are being allocated. It doesn't tell a product team whether onboarding is failing. It doesn't tell billing ops whether payment retries are underperforming. It doesn't tell customer success whether contraction is concentrated in one plan.
SaaS teams need a retention ratio calculation that isolates the original base, separates customer count from revenue impact, and maps cleanly to interventions. That's the version worth operationalizing. Everything else belongs in a different meeting.
Customer Retention vs Revenue Retention Formulas
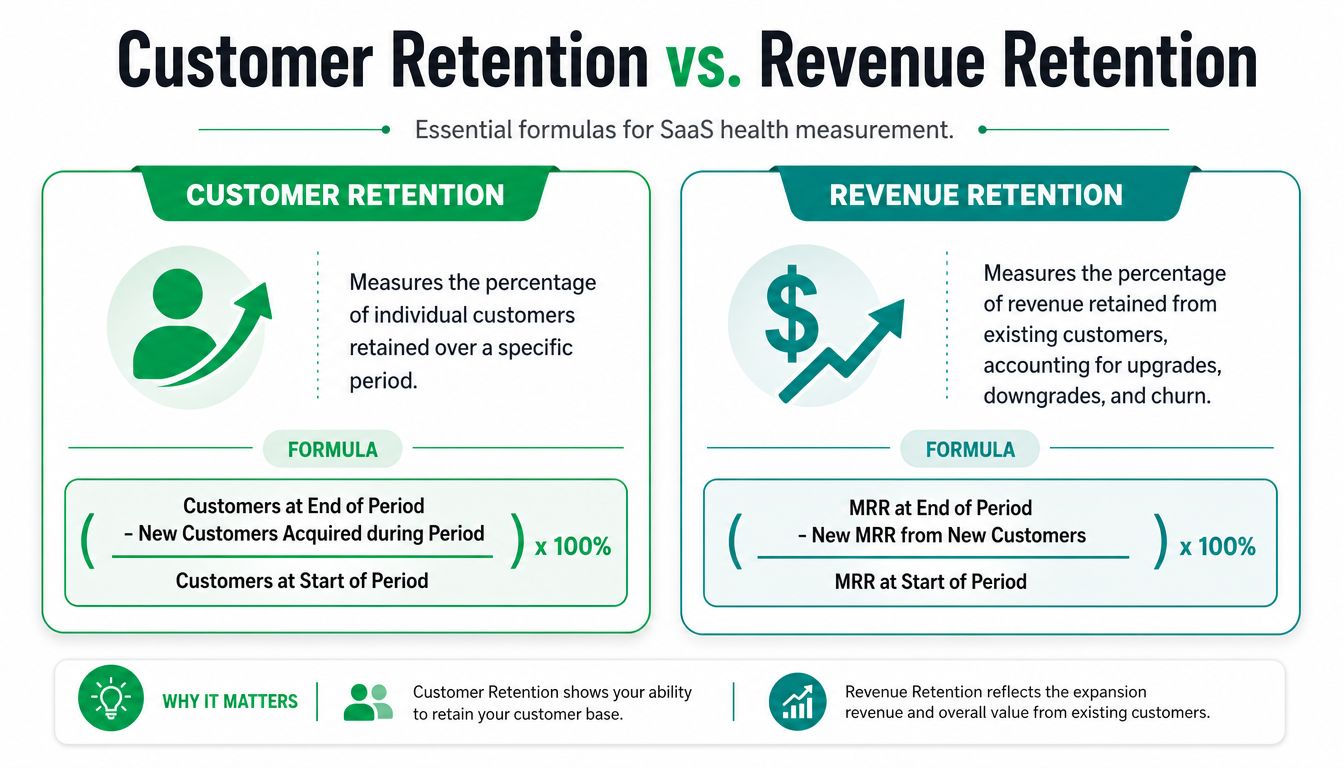
The cleanest way to stop retention confusion is to define each formula by the question it answers. Customer retention tells you how many of your original accounts stayed. Revenue retention tells you what happened to the dollars attached to those accounts.
Why customer retention is only the first cut
For subscription software, the standard customer retention formula is RR = [(E – N) / S] × 100, where E is end-period customers, N is new customers acquired during the period, and S is start-period customers, as outlined in Mindstamp's retention rate guide.
The formula matters because it isolates the original cohort. If you start a month with one set of customers and add new logos during that same month, those new customers shouldn't make your retention look better. They belong to acquisition, not retention.
The practical meaning of each variable is:
- S is the customer count at the start of the period.
- N is every customer added during that period.
- E is the total customer count at the end.
- E minus N gives you the customers from the original base who are still present.
That makes customer retention a strong metric for product usage, onboarding quality, and account survival. It's especially useful when teams want to understand logo churn separate from contract value. If you're also trying to normalize account value inputs, this guide to calculating average revenue helps frame the revenue side.
How to think about GRR and NRR
Customer retention is necessary, but it isn't sufficient. In SaaS, losing one large account can matter more than losing several low-value accounts. That's why revenue retention usually becomes the metric executives trust most.
A practical way to structure the two core revenue formulas is:
| Metric | Practical formula | What it answers |
|---|---|---|
| GRR | (Starting MRR - Churned MRR - Contraction MRR) / Starting MRR | How much recurring revenue from the starting base did you preserve before expansion? |
| NRR | (Starting MRR - Churned MRR - Contraction MRR + Expansion MRR) / Starting MRR | Did the starting base grow or shrink after upgrades, downgrades, and churn? |
A few definitions keep teams aligned:
- Churned MRR means recurring revenue lost from customers who fully canceled.
- Contraction MRR means recurring revenue lost from downgrades, seat reductions, or plan changes.
- Expansion MRR means recurring revenue gained from upgrades, additional seats, add-ons, or usage growth from the existing base.
- Starting MRR is the recurring revenue attached to the cohort at the opening of the period.
Revenue retention is where many companies discover that their logo story and their money story aren't the same.
That's why a rigorous retention ratio calculation has to track both. A company can keep many customers while losing too much high-value revenue through downgrades. It can also lose some small accounts while expanding enough existing accounts to stay healthy on an NRR basis.
One more distinction matters. Customer retention, GRR, and NRR are operating metrics for SaaS. They are not the same as the accounting retention ratio used in financial analysis. If a report says "retention ratio" but doesn't define the denominator, someone will misread it.
A Step-by-Step Worked Example with Cohorts
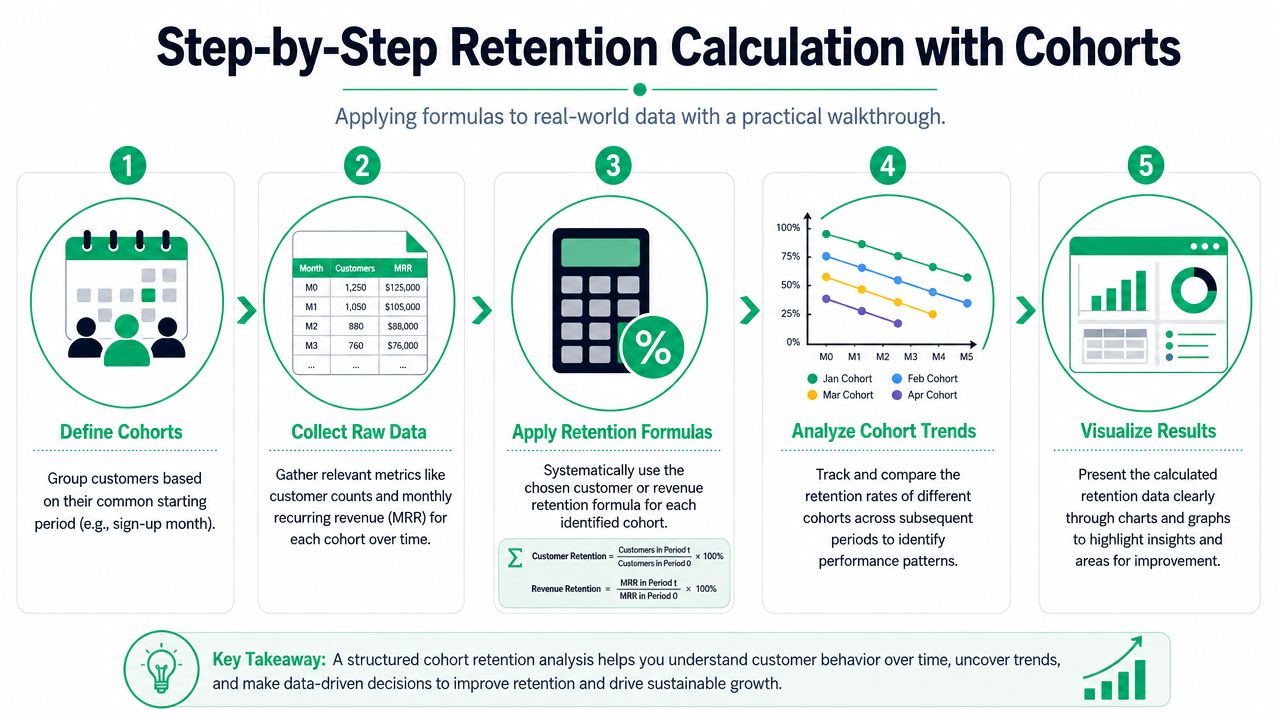
The formulas look simple until real billing data shows up. Mid-cycle upgrades, cancellations after renewal, paused accounts, failed cards, and trial conversions all make a naive spreadsheet break fast. The easiest way to stay sane is to work from a single cohort and apply the formulas in a fixed order.
Start with a clean cohort definition
Take a fictional company, SaaSCo. It wants to measure retention for a monthly cohort review. The team chooses all paying customers active on the first day of the month as the starting cohort.
During the month, SaaSCo tracks five buckets of change:
- Starting customers from day one.
- New signups added during the month.
- Full cancellations from the starting base.
- Downgrades from customers who stayed but reduced spend.
- Upgrades from customers who expanded.
That structure matters more than the tooling. You can use Stripe data, a warehouse model, or a finance sheet. If the buckets aren't mutually exclusive, the results won't be trustworthy.
A short walkthrough helps make the mechanics visual:
Apply the formulas in order
First calculate customer retention. Start with the opening customer count. Then remove any new customers from the ending customer count. That gives you the surviving customers from the original base.
Second calculate GRR. Start with beginning MRR for that same cohort. Subtract revenue lost to full cancellations. Subtract revenue lost to downgrades or contractions. Divide what's left by beginning MRR.
Third calculate NRR. Use the same GRR framework, then add expansion MRR from that original cohort back into the numerator. New customer revenue stays out. NRR is about the starting book of business only.
A working sequence for SaaSCo looks like this:
| Step | Data input | What to exclude |
|---|---|---|
| Customer retention | Start customers, end customers, new customers | New logos added during the period |
| GRR | Starting MRR, churned MRR, contraction MRR | Expansion MRR and all new logo MRR |
| NRR | Starting MRR, churned MRR, contraction MRR, expansion MRR | All new logo MRR |
This order prevents a common reporting problem. Teams often start with total ending MRR and try to back into retention. That works poorly when acquisition is strong. New sales can hide damage in the installed base.
If you can't reconcile every dollar of ending MRR into starting base, new business, expansion, contraction, or churn, your retention model isn't finished.
Why cohorts change the conversation
A single blended retention number can look stable while newer customers leave faster than older ones. Cohorting solves that. Instead of asking "what was retention last month," you ask "how is the January 2026 customer cohort performing compared with the February 2026 cohort after the same amount of time in product."
That shift usually exposes the underlying drivers:
- Onboarding issues appear when early-life retention is weaker in newer cohorts.
- Pricing problems appear when contraction clusters around a specific plan launch.
- Support gaps show up when accounts with certain usage patterns churn before adoption deepens.
- Billing friction appears when otherwise healthy accounts lapse after payment failures.
Cohorts also make interventions testable. If you launch a revised cancellation flow, a pause option, or a more targeted downgrade path, you can compare retention behavior for cohorts exposed to the new experience versus the prior one. The same applies to payment recovery workflows.
Blended retention is useful for executive reporting. Cohort retention is what operators use to find the leak.
Interpreting Your Results and Avoiding Common Pitfalls
A retention metric becomes useful when it changes a decision. A weak interpretation layer is why many teams calculate retention carefully and still act slowly.
What different retention patterns usually mean
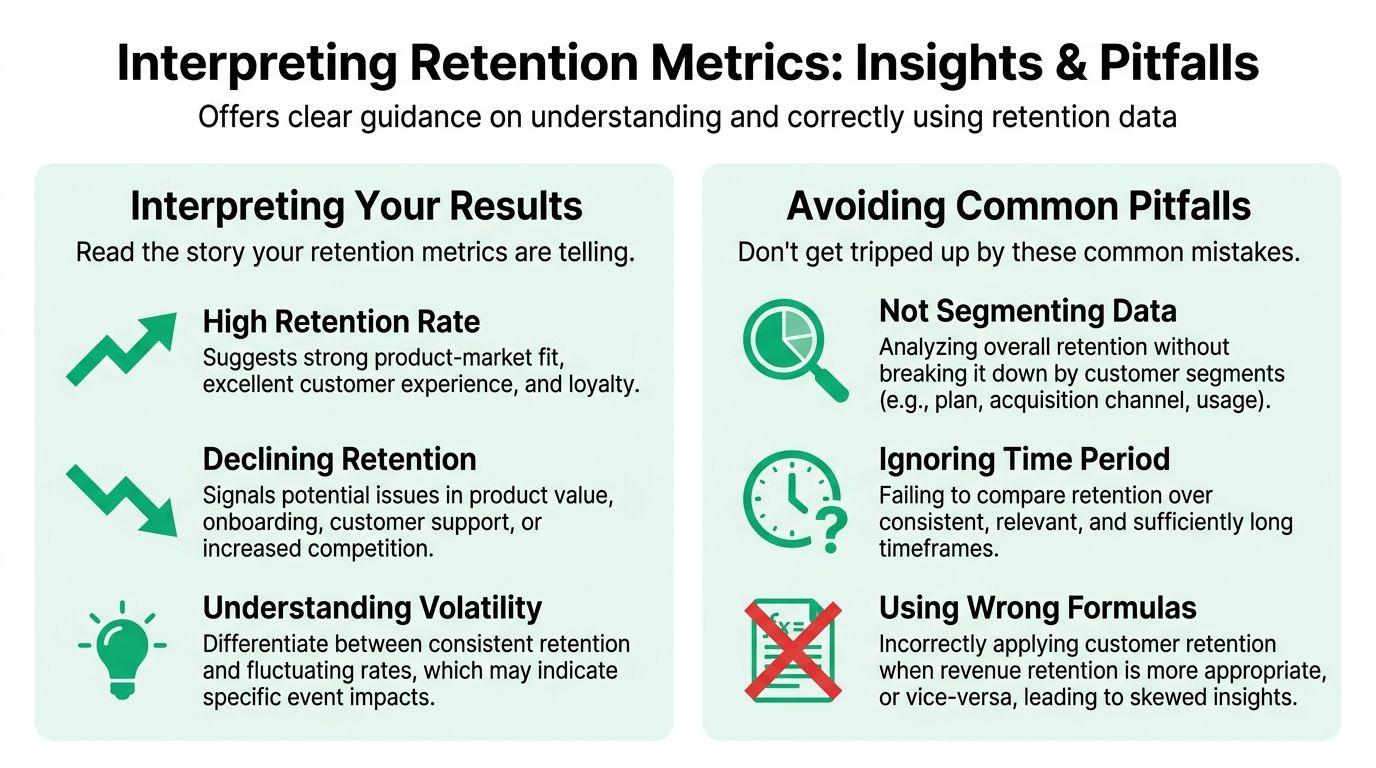
Start by reading the combination, not the isolated metric.
If customer retention is weak and GRR is also weak, the product likely has a genuine churn problem. Customers are leaving, and the revenue impact confirms it. This often points to onboarding gaps, poor activation, mismatched positioning, or avoidable cancellation friction.
If customer retention looks decent but GRR is under pressure, the team may be losing larger accounts or seeing meaningful downgrades. In that case, counting logos gives false comfort. Revenue segmentation by plan and account value becomes more important than top-line customer counts.
If GRR is solid but NRR is flat, the base may be stable without an expansion engine. That's not a crisis, but it changes the playbook. Product packaging, upgrade triggers, and account development need more attention than churn rescue.
If NRR is strong while customer retention is mixed, expansion may be masking weak account survival among lower-value segments. Sometimes that's acceptable. Sometimes it signals a product that's only sticky for part of the market.
Mistakes that break retention ratio calculation
The most common issue is denominator pollution. Teams accidentally include new business in retention math and then congratulate themselves for acquisition work.
A second issue is averaging cohorts too loosely. I4A's guidance on retention rate calculation notes that teams should use rolling 12-month sums instead of averaging cohorts, specifically Sum of renewals past 12 months ÷ Sum of members due past 12 months × 100, and it warns that failing to segment by plan value or billing state can hide high-value account risk.
That guidance matters in SaaS because timing distortion is real. Annual snapshots often arrive too late to be actionable. Rolling calculations surface deterioration earlier and keep the denominator anchored to accounts that are up for renewal.
Common failure points usually look like this:
- Including new customers in the base: This inflates retention and mixes acquisition with customer survival.
- Combining voluntary and involuntary churn: A user who cancels for lack of value is a different problem from a customer who misses a payment.
- Ignoring contraction: Teams track full cancellations but miss the downgrade path that gradually erodes MRR.
- Skipping segment cuts: Enterprise plans, SMB plans, annual contracts, and monthly subscriptions rarely behave the same way.
- Reading one period in isolation: Retention always needs trend context.
Good retention reporting doesn't just say what happened. It says where, to whom, and through which failure mode.
Taking Action Based on Your Retention Metrics
Retention work pays off when each metric maps to a specific intervention. Otherwise teams end up with elegant dashboards and generic responses.
When voluntary churn is the problem
If customers are intentionally canceling, don't treat that as a single bucket. Separate "too expensive," "missing feature," "temporary pause," "no longer needed," and "switching to competitor." Those require different responses.
A strong cancellation flow does three things at once:
- Captures intent cleanly: Ask for a reason at the moment of cancellation, inside the product, not weeks later in a survey.
- Routes by account context: Plan, usage, account value, and stated reason should determine the next step.
- Offers the right save path: Pause, downgrade, targeted discount, support handoff, or a clean cancellation.
Operators usually discover whether they have a product problem, a packaging problem, or a timing problem. If many customers ask for a lower-cost option, packaging may be misaligned. If they ask to pause, the value may be seasonal or project-based. If they cite one missing capability repeatedly, Product has a clearer priority queue than any generic feedback form can provide.
When involuntary churn is the problem
If retention erosion comes from failed payments, the fix is operational rather than strategic. You need retry logic, customer reminders, an easy card-update path, and sensible account state management while recovery is in progress.
That work deserves its own reporting lane because involuntary churn behaves differently from voluntary churn. It often clusters around billing state, payment method, and renewal timing. The wrong move is to merge it into general churn and assume customers left because the product missed the mark.
Teams that separate the two get cleaner decisions:
| Retention issue | Typical signal | Better response |
|---|---|---|
| Voluntary churn | Clear cancellation intent | Save offers, routing, feedback capture, product or packaging fixes |
| Involuntary churn | Failed payment or billing lapse | Retry schedule, reminders, card update flow, billing operations follow-up |
For many subscription businesses, this distinction is the difference between guessing and managing.
Why this becomes a growth system
Retention isn't just a defensive metric. It shapes growth planning. The financial version of the retention ratio also plays a role in long-term modeling because Future Growth = ROE × Retention Ratio, a relationship discussed in this explanation of the sustainable growth model. In SaaS operations, the lesson is similar even though the metric differs: growth quality depends on what you keep, not just what you add.
That is why retention ratio calculation belongs close to execution. If the data says voluntary churn is concentrated in a specific plan, fix the cancellation path and packaging there first. If the data says MRR loss comes mostly from failed charges, tighten billing recovery before launching another acquisition campaign. If you're working on the operating side of churn reduction, this practical guide to reducing churn rate is a useful next read.
The teams that improve retention consistently don't treat it as one number. They treat it as a routing system for action.
Frequently Asked Questions About Retention Calculation
What is a good retention ratio in SaaS
There isn't one universal answer. A good number depends on contract length, pricing model, product maturity, customer segment, and whether you're looking at customer retention, GRR, or NRR. In practice, the more useful question is whether your retention is improving for the right cohorts and whether revenue retention is strong in the segments you want to scale.
How often should you calculate retention
Most SaaS teams should calculate it monthly and review trends on a rolling basis. Fast-moving businesses often watch cancellation intent and payment recovery much more frequently, but monthly is usually the cleanest cadence for executive reporting. The key is consistency in cohort definition and exclusion rules.
When should you use customer retention vs revenue retention
Use customer retention when you want to understand account survival, onboarding quality, and logo churn. Use revenue retention when you need to understand financial durability, contraction, and expansion within the existing base. Most scaling SaaS companies need both. Customer retention tells you how many stayed. Revenue retention tells you whether the customers who stayed still matter economically.
If your team is measuring retention but still struggling to connect the metric to real interventions, Revcover is built for that gap. It helps subscription SaaS companies connect Stripe-powered cancellation flows, save offers, payment recovery, and revenue attribution so you can see which actions recover MRR instead of just reporting churn after the fact.