GRR vs NRR: Which Metric Truly Drives SaaS Growth?
Ayush Soni
Founder, Revcover
On this page
- The Hidden Story Behind Your Revenue Metrics
- Defining the Core Retention Metrics
- What GRR measures
- What NRR measures
- GRR vs NRR A Strategic Comparison for SaaS Leaders
- GRR vs. NRR At a Glance
- Which question each metric answers
- The Dangerous Gap Between GRR and NRR
- When expansion hides erosion
- Why teams make worse product decisions
- Actionable Strategies to Improve Both Metrics
- First improve GRR
- Then grow NRR without letting it obscure risk
- Unifying Retention with a Smarter System
SaaS leaders often give NRR top billing because it signals growth inside the customer base. That habit creates a blind spot. A business can post strong NRR while its core retention engine is weakening, especially when a small group of larger accounts drives most expansion.
The strategic risk is straightforward. If GRR is slipping, expansion can cover up product friction, poor onboarding, weak fit in certain segments, or rising price sensitivity. Board reporting still looks healthy. Product and GTM decisions start drifting toward the customers who expand, not the customers who are leaving unnoticed.
Series A and B founders usually run into this during roadmap planning and forecast reviews. A handful of enterprise accounts ask for advanced workflows, security features, or custom support, and those requests are easy to justify because expansion revenue is visible. At the same time, churn from SMB or mid-market customers gets absorbed into a net retention figure that looks acceptable at first glance. Teams then invest in features that grow top accounts while leaving the main causes of logo and revenue loss unresolved.
A better framing is to treat GRR and NRR as answers to different operating questions. GRR shows how much revenue you keep before any help from expansion. NRR shows whether the installed base produces net growth after contraction, churn, and upsell are all counted. Both matter. But when GRR is weak, NRR can turn into camouflage, and camouflage is expensive.
The Hidden Story Behind Your Revenue Metrics
A founder can report strong NRR and still have a retention problem.
That's the blind spot in most discussions of GRR vs NRR. NRR gets celebrated because it captures expansion. Investors like it because it shows whether the installed base is compounding. Operators like it because it combines churn, contraction, and upsell into one headline number. But compression has a cost. When several different revenue movements collapse into one metric, the causes behind those movements get harder to see.
GRR is the harder metric to love because it doesn't let the business hide. It strips out upgrades, cross-sells, and add-ons. What remains is the base question every SaaS company has to answer: are customers keeping the core product long enough, and at enough spend, to create a stable revenue floor? HubiFi defines Gross Revenue Retention as the percentage of recurring revenue retained from the existing customer base over a period, excluding expansion revenue and counting only losses from churn and downgrades (HubiFi on GRR fundamentals).
High NRR tells you the account base can grow. High GRR tells you the product earns the right to grow.
The strategic mistake is treating those two signals as interchangeable. They are not. A company with solid GRR and modest NRR usually has a stable product and an unfinished expansion engine. A company with flashy NRR and weak GRR may have the opposite problem: strong monetization from a subset of accounts, weak retention in the broader base.
That distinction matters because the fixes are different. One calls for better packaging, pricing, and account growth motions. The other calls for product correction, churn analysis, and tighter revenue protection. If you optimize for NRR before you understand GRR, you risk scaling a leak instead of a system.
Defining the Core Retention Metrics
Founders often treat GRR and NRR as finance definitions. They are operating filters. The formula you emphasize shapes which problems your team sees early and which ones stay hidden until they get expensive.
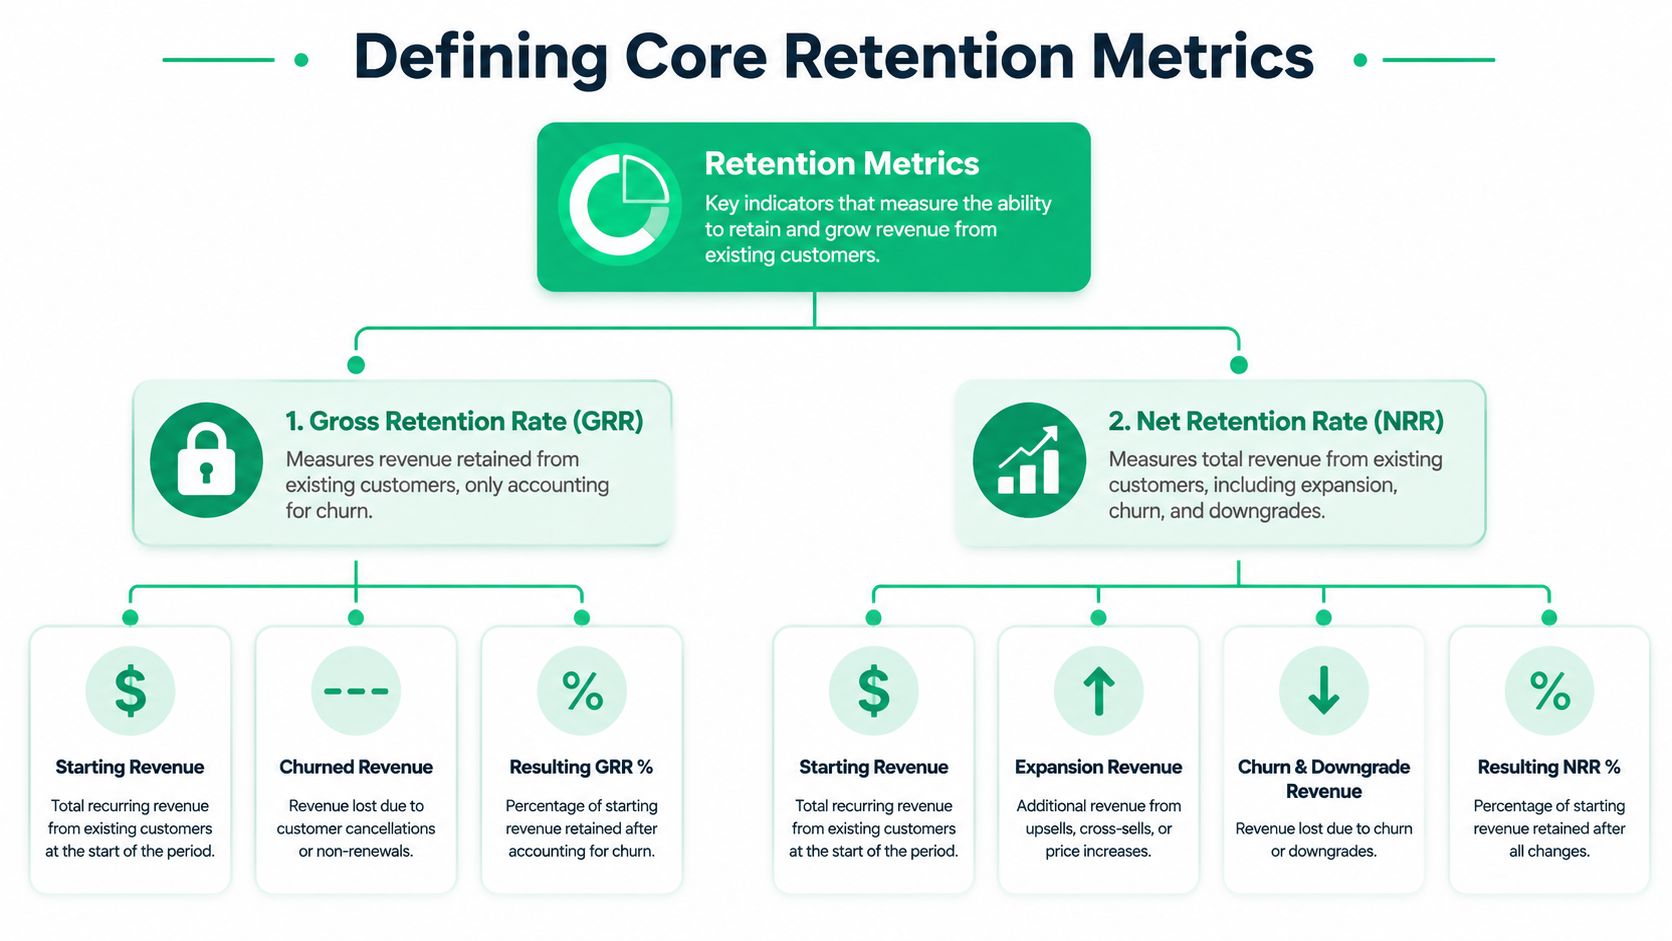
Both metrics start from the same place: recurring revenue from existing customers at the beginning of a period. Neither includes new-logo revenue. The only real difference is what happens after losses. GRR stops at churn and contraction. NRR adds expansion back in.
What GRR measures
Gross Revenue Retention measures how much of your starting recurring revenue remains after churn and downgrades.
GRR = (Starting MRR - Churn MRR - Contraction MRR) / Starting MRR
Using a worked example from Corporate Finance Institute, a company that begins with $1,000,000 in MRR, loses $100,000 to churn and $50,000 to downgrades, and gains $200,000 in expansion would post 85% GRR and 105% NRR (CFI explanation of GRR and NRR formulas).
The GRR result is the cleaner diagnostic. It isolates the revenue your product kept before sales, pricing, or account management created any upside. For a SaaS leadership team, that matters because weak GRR usually points to a product, onboarding, adoption, support, or packaging problem. Expansion cannot fix those issues. It can only obscure them for a while.
A practical read on GRR:
- High GRR suggests the core product is holding revenue steadily across the installed base.
- Low GRR means churn or downgrades are eroding the base faster than the company should accept.
- Improving GRR usually indicates the business is fixing a retention driver, not just extracting more from a few large accounts.
What NRR measures
Net Revenue Retention measures what remains from the same starting base after losses and after expansion revenue is added back.
NRR = (Starting MRR - Churn MRR - Downgrade MRR + Expansion MRR) / Starting MRR
In the same example, the company looks healthy on NRR because expansion more than offsets revenue lost elsewhere. That is why NRR gets so much board-level attention. It answers a legitimate question: can the existing customer base grow without relying on new acquisition?
It is also where many SaaS teams get misled.
A strong NRR can coexist with weak account health in the broader base. If a small set of customers upgrades aggressively while another segment churns or downgrades, NRR can stay above 100% even as product-market fit weakens outside the top tier. The operating risk is straightforward. Leaders keep funding expansion plays, sales pushes premium tiers, and product teams build for power users, while the retention problem that sets the revenue floor remains unresolved.
Practical rule: Use GRR to test whether customers keep the product they already bought. Use NRR to test whether your account base can grow after it clears that retention test.
One final point changes how these metrics should be read. GRR will always be less than or equal to NRR. The difference between them is not a technical detail. It shows how much expansion is compensating for underlying loss. Small gaps usually indicate modest upside on top of a stable base. Large gaps deserve scrutiny, because they often signal that headline growth is being carried by a narrow slice of accounts while the wider customer base is less healthy than the net number suggests.
GRR vs NRR A Strategic Comparison for SaaS Leaders
If you're running a SaaS company, these metrics belong to different decisions.
GRR tells you whether your business has a durable revenue floor. NRR tells you whether your current customers can grow fast enough to compound that floor. The problem starts when leaders ask one metric to answer both questions.
GRR vs. NRR At a Glance
| Criterion | Gross Revenue Retention (GRR) | Net Revenue Retention (NRR) |
|---|---|---|
| What it includes | Starting recurring revenue minus churn and downgrades | Starting recurring revenue minus churn and downgrades, plus expansion |
| What it excludes | Upgrades, cross-sells, add-ons | New customer revenue |
| Main signal | Baseline revenue stability | Net growth from existing customers |
| Best use | Assessing product stickiness and retention quality | Assessing expansion effectiveness and account growth |
| What a weak result usually suggests | Core value, onboarding, usage, pricing fit, or service issues | Expansion motion is weak or losses outweigh upgrades |
| Main blind spot | It ignores upside from customer expansion | It can hide churn and contraction inside a good-looking net figure |
| Best audience | Product, customer success, RevOps, founders diagnosing retention | Leadership, finance, investors assessing compounding revenue |
Which question each metric answers
Ask GRR when the question is, “Are customers keeping what they already bought?”
That makes GRR the sharper tool for product-market fit diagnostics. If customers are downgrading or canceling, GRR will surface it immediately. It doesn't let growth from your best accounts smooth over friction in onboarding, poor activation, weak support handoffs, or packaging mismatches.
Ask NRR when the question is, “Can our current customer base expand fast enough to outgrow losses?”
That makes NRR a strategic growth metric. It is especially helpful when you're evaluating account management, pricing architecture, add-on attach potential, seat expansion, or usage-based monetization. It tells you whether your land-and-expand motion is doing real work.
The nuance founders often miss is that strong NRR does not prove strong product health across the whole customer base. It proves that the net result of retention and expansion is positive. Those are not the same thing.
Show investors NRR because it speaks to compounding growth. Run the company on GRR plus segmented NRR because that tells you where growth is durable and where it is borrowed.
A few leadership implications follow from that distinction:
- For product leaders, GRR is usually the better early warning signal. It reacts to churn and contraction before expansion can hide them.
- For finance teams, NRR is critical for forecasting recurring revenue from the installed base, but only when the underlying revenue movements are classified correctly.
- For customer success teams, the pair matters more than either metric alone. A team can drive strong expansion in one segment while another segment deteriorates.
- For founders, the question isn't “Which one should I pick?” It's “What operating behavior will I reward if I over-index on one?”
When a company rewards NRR in isolation, teams can start chasing upgrade revenue from accounts already inclined to grow. That behavior looks efficient on paper. It can also delay the harder work of fixing churn drivers that depress GRR. Over time, the business becomes dependent on expansion to offset losses that should have been prevented.
The Dangerous Gap Between GRR and NRR
A high NRR can make a weak retention engine look healthy.
That is the blind spot. GRR measures how much revenue you keep before expansion enters the picture. NRR can stay strong even while churn and downgrades spread through the base, as long as a concentrated group of accounts expands fast enough to cover the loss. For a founder, that distinction matters because the operating response is completely different. One points to a durable product and customer model. The other points to growth being subsidized by a narrow slice of the customer base.
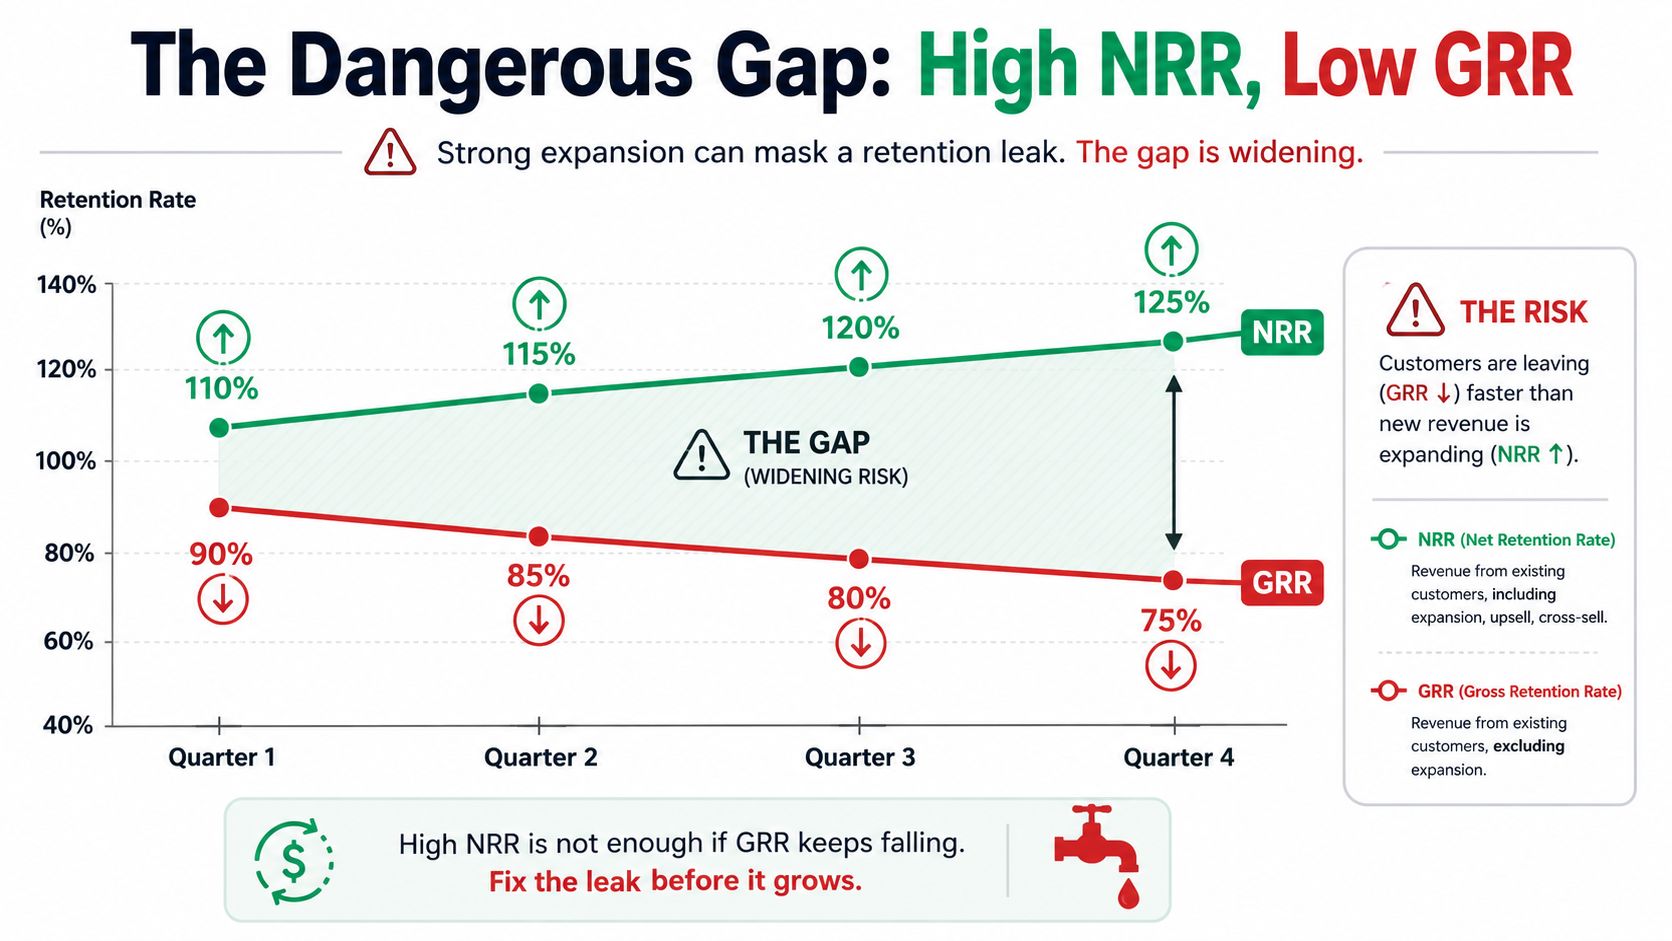
When expansion hides erosion
The dangerous pattern is simple. Revenue lost from churn and contraction is rising, but expansion from a smaller set of customers keeps net retention attractive. Leadership sees a healthy top-line retention metric. The underlying customer base is getting less stable.
That gap creates two predictable errors.
The first is diagnostic. Teams infer broad product-market fit from net expansion, even though the gains may be concentrated in accounts with very different needs, budgets, and implementation support than the rest of the base. The second is allocative. Leaders put more budget into upsell motions, enterprise requests, and account expansion because those investments appear to be working, while the sources of revenue leakage remain underfunded.
The right way to examine the gap is to segment it. Compare GRR and NRR by account tier, pricing plan, acquisition cohort, and payment behavior. If expansion is concentrated in a few large accounts while smaller customers contract or churn, your retention metrics are describing concentration risk, not product strength.
High NRR paired with weak GRR usually means your best-fit customers are growing faster than your weaker-fit customers are leaving. That can support revenue for a while. It does not fix the leak.
Why teams make worse product decisions
The product roadmap often absorbs the consequences first.
When expansion revenue is the headline metric, product teams listen most closely to the accounts driving that expansion. Enterprise controls, advanced permissions, custom reporting, and deeper integrations start to dominate prioritization. Those investments can be rational. They become costly when they are funded by ignoring why smaller or earlier-stage customers are leaving.
Cancellation intelligence becomes critical in that scenario. Teams need to know why customers leave, whether the loss was product-driven or billing-driven, and which reasons are clustered in meaningful revenue segments. This breakdown of voluntary vs. involuntary churn is a useful starting point. Without that separation, companies combine failed payments, missing features, low usage, poor onboarding, and procurement friction into one churn category and then ship fixes that miss the root cause.
A wide GRR-NRR gap is not just a reporting nuance. It changes who gets heard, which problems get prioritized, and where the company places its next product and go-to-market bets. If you optimize NRR before stabilizing GRR, you can end up building for the accounts that are already succeeding while teaching yourself to ignore the reasons the rest are leaving.
Actionable Strategies to Improve Both Metrics
SaaS leaders usually ask how to raise NRR. The better question is what your expansion is hiding.
Protect GRR first. Expand NRR from a cleaner base. That sequence matters because NRR can stay strong while customer quality deteriorates underneath it. If GRR is weak, upsell success can create false confidence, distort forecast assumptions, and push teams toward product bets that serve expanding accounts while ignoring the reasons other customers leave.
First improve GRR
GRR improves when you reduce avoidable revenue loss with tighter instrumentation and faster intervention. That starts before the invoice is lost.
- Capture churn reasons at the moment of intent. In-product cancellation flows produce better data than delayed surveys because they tie the stated reason to plan, tenure, and account value while the decision is still current.
- Separate downgrades from full cancellations in reporting and response. Contractions usually point to packaging, seat count, or budget fit. Full cancellations more often indicate weak onboarding, missing product value, or a failed handoff.
- Treat involuntary churn as a retention process. Failed payments, card expiry, and billing failures reduce GRR even when customer demand has not changed.
- Create different save paths by segment. A low-usage self-serve account may need a pause, downgrade, or education flow. A larger account with the same signal may justify a success intervention before renewal risk compounds.
Classification quality matters here. Maxio notes that subscription businesses often misreport GRR and NRR because mid-cycle contractions and plan changes are hard to reconcile cleanly in billing data (Maxio on mid-cycle contraction and reporting errors). The strategic implication is straightforward. If contractions, downgrades, recoveries, and cancellations are blended together, leadership can overestimate product-market fit and underinvest in the fixes that would raise retention.
Then grow NRR without letting it obscure risk
Once GRR is more stable, expansion becomes a better signal. You can then read NRR as customer growth, not as a partial offset to leakage.
Use a few rules to keep it honest:
- Use churn feedback to fix packaging before pushing upsells. If customers repeatedly cite price mismatch or poor fit, the issue is often your value ladder, not sales execution.
- Tie expansion offers to usage and outcomes. Healthy upsell motion follows adoption, broader team penetration, or clear ROI. Without those signals, expansion discussions often turn into pricing negotiations.
- Segment NRR by cohort and account tier. This prevents one strong enterprise segment from masking broad weakness in SMB or newer cohorts.
- Review retention and expansion on the same account timeline. Teams should see whether an account expanded after successful onboarding, after a downgrade, or after a recovery event. The sequence changes how you interpret the revenue.
If your team uses different labels across finance, CS, and product, a clear net dollar retention framework helps standardize what counts as expansion, contraction, and retained revenue.
Expansion should strengthen an already durable customer base. If it is covering for weak GRR, you do not have a growth engine yet. You have a visibility problem.
Unifying Retention with a Smarter System
Most retention problems persist because the data and workflows are split. Billing events live in Stripe. Cancellation reasons sit in forms or support tickets. Expansion signals live in CRM notes or customer success tools. Finance sees net outcomes. Product sees fragments.
That separation is exactly why the GRR vs NRR conversation gets distorted. Leaders can see the headline number but not the sequence of events that produced it. A customer tries to cancel, accepts a downgrade, misses a payment later, then expands months after a support intervention. If those actions are tracked in separate systems, the company learns less than it should from each account.
A better operating model connects the full retention loop. Cancellation intent should feed churn intelligence. Payment recovery should sit alongside voluntary save flows. Revenue outcomes should map back to the offer, reason, segment, and billing state that preceded them. Then GRR becomes a manageable operating metric rather than a monthly surprise, and NRR becomes a cleaner reflection of actual customer growth.
That kind of closed-loop view also improves prioritization. Product teams can see which churn reasons are tied to meaningful revenue. Success teams can intervene earlier on high-risk accounts. Finance teams can forecast from cleaner classifications. And leadership can compare retention quality with expansion quality instead of letting one obscure the other.
If you care about a more complete view of customer health beyond pure revenue math, engagement signals belong in the same conversation. This overview of engagement metrics is a useful complement because weak engagement often shows up before weak retention.
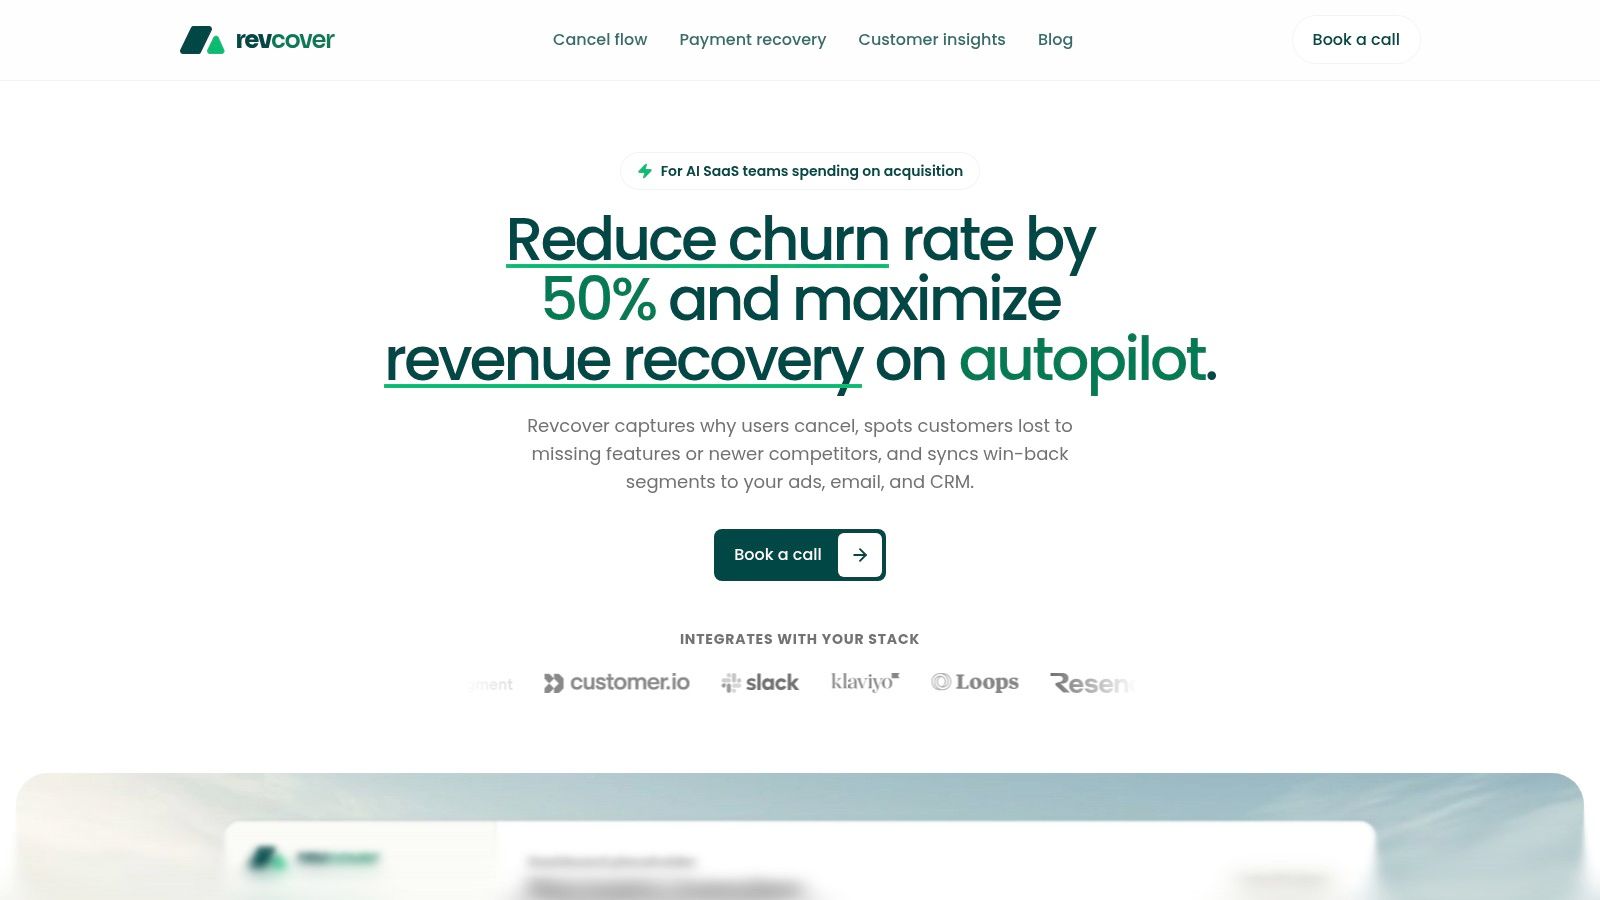
If you want to improve GRR without losing sight of NRR, Revcover gives Stripe-based SaaS teams one system for cancellation flows, payment recovery, churn insight, and recovered MRR reporting. It helps you see which save paths work, which churn reasons matter, and how retention actions change revenue outcomes across the full customer lifecycle.