
How to Calculate Run Rate for SaaS Revenue

Ayush Soni
Founder, Revcover

On this page
- Why a Simple Annualization Is Often the Wrong Answer
- The real question behind the formula
- The Core Annualization Formula and Its Variants
- Use the cleanest recent period you trust
- When the formula behaves well and when it doesn't
- Converting MRR to ARR and Back
- Use the right unit in the right room
- Building a Churn- and Cohort-Adjusted Run Rate
- Why cohort quality matters
- What not to do with the adjustment
- Factoring in Failed Payments, Retries, and Recovered MRR
- Keep recovery visible and avoid double counting
- Why attribution matters as much as arithmetic
- Putting Run Rate in Dashboards and Board Decks
- Match the metric to the audience
- A simple decision rule
- Common Pitfalls That Distort the Number
- The four errors that show up most often
Most advice on how to calculate run rate stops at a clean shortcut, multiply the last month by 12 and move on. That works only when revenue is steady and the customer base behaves nicely, which is rare in subscription software. In practice, the better question is not what the math looks like, but which part of the revenue base is repeatable next quarter.
For SaaS, that means separating the simple annualization from the messy reality underneath it. Churn, failed payments, save offers, and recovered MRR all change the answer, sometimes enough to make a board-facing number look overly confident if you skip the context. A useful run rate is still valuable, but only when it reflects the quality of the revenue, not just the size of the latest snapshot.
Why a Simple Annualization Is Often the Wrong Answer
The default advice, take a monthly number and multiply it by 12, is not wrong. It's just incomplete. In a SaaS business, that shortcut assumes the current revenue base is stable, fully collectible, and made up of customers who'll keep paying at the same pace.
That assumption breaks fast when a business is seeing failed payments, cancellation pressure, or a recent spike from one cohort that hasn't had time to mature. A clean monthly snapshot can flatter the business if recent wins are concentrated in a narrow segment or if involuntary churn is rising underneath the headline number. The result is a run rate that looks board-ready but doesn't tell you what will recur.
The real question behind the formula
A practical run rate check starts with a simpler filter. Ask whether you're projecting gross sales, recognized recurring revenue, or repeatable subscription revenue after churn and recovery. Those are different answers, and they belong in different conversations.
Practical rule: if a number would surprise your customer success team, it probably shouldn't be the only number in the board deck.
That's why most serious revenue teams end up using multiple versions of the metric. A straight annualization is useful for fast directional reading. MRR to ARR helps teams speak the finance language. A churn-adjusted view gets closer to what next quarter can hold. A recovery-aware version goes one step further and treats failed-payment recovery and save outcomes as part of the revenue engine, not an afterthought.
The point isn't to complicate the math for its own sake. It's to avoid presenting a single number as if all revenue were equally dependable. In subscription businesses, the question behind how to calculate run rate is really about repeatability, and repeatability depends on customer behavior.
The Core Annualization Formula and Its Variants
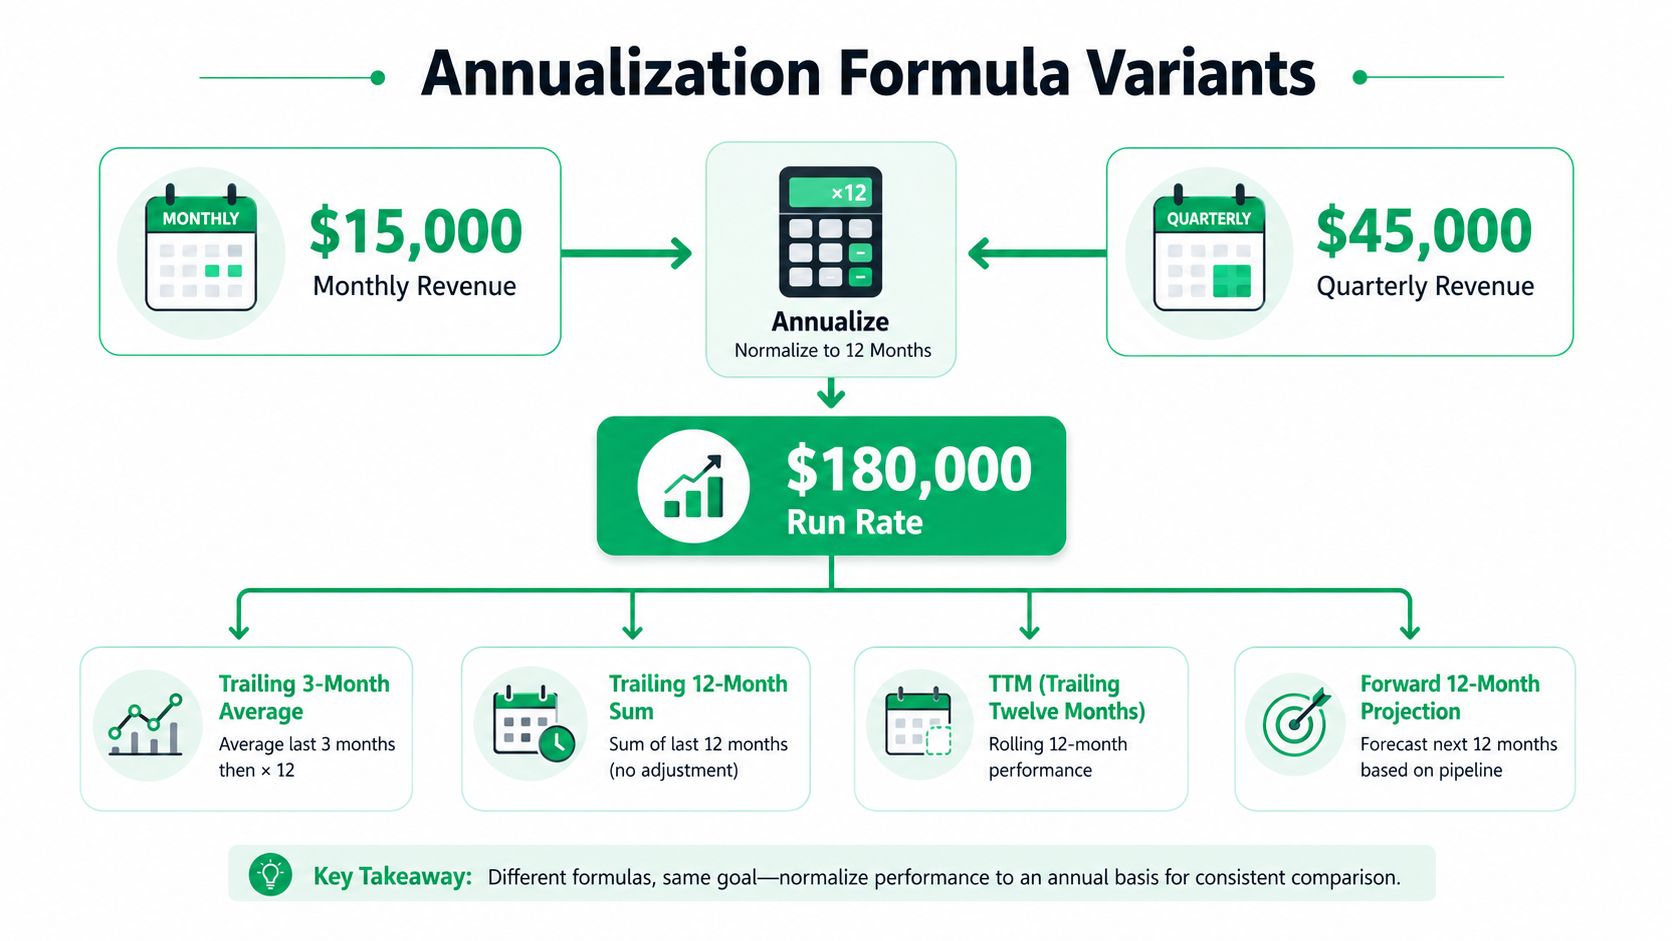
The foundational formula is simple. Run rate = revenue in period × number of periods per year, and that's the cleanest way to annualize a recent performance window. If a company generates $15,000 in one month, the annual run rate is $180,000. If it reports $45,000 in one quarter, the annualized run rate is also $180,000. Wall Street Prep's run-rate guide lays out that structure directly.
Use the cleanest recent period you trust
For a steady business, the most recent clean month or quarter is usually the easiest input. Pick the period that best reflects current operating reality, then document the period so everyone knows what the figure is based on. If the window is not a neat month or quarter, the irregular-period version is useful, (revenue ÷ days in period) × 365. That's the right shape when your data covers an odd-length window.
A useful mental model is to keep the arithmetic boring and the judgment strict. Annualize the period only after you've checked whether the window was representative. If the month includes a launch spike, a major price change, or a temporary drop in billing, the math still works, but the number becomes less trustworthy.
When the formula behaves well and when it doesn't
Straight annualization works best when revenue is relatively stable, churn is low, and there isn't a big one-time event sitting inside the period. It gets shakier when the business is in ramp mode, when seasonality dominates purchase behavior, or when one acquisition has temporarily inflated the base.
| MRR to ARR quick reference | ||
|---|---|---|
| MRR | ARR | Notes |
| monthly revenue figure | annualized monthly revenue | multiply by 12 |
| quarterly revenue figure | annualized quarterly revenue | multiply by 4 |
| irregular period revenue | annualized from days in period | use days-based formula |
For a full working guide on the ARR side of the bridge, this internal ARR calculation reference is the cleanest companion. The main thing to keep straight is that the formula is only as good as the period you feed it.
Converting MRR to ARR and Back
For SaaS, the most common run-rate conversation is the bridge between MRR and ARR. The conversion is simple: ARR = MRR × 12. If a business has $48,000 MRR, its ARR is $576,000. The inverse is just as straightforward, MRR = ARR ÷ 12, which is useful when the board talks in annual terms but the operations team works month to month.
Use the right unit in the right room
MRR belongs in operational dashboards because it reacts quickly to cancellations, upgrades, downgrades, and payment issues. ARR belongs in board decks, sales materials, and higher-level planning because it gives a normalized annual view. Finance and RevOps teams usually need both, but they need them for different reasons.
The practical mistake is to treat ARR as if it were a totally different metric from MRR. It's not. It's the same recurring revenue base, just expressed on a different time scale. That's why the monthly number is often better for diagnosing what changed, while the annual number is better for summarizing scale.
Keep the language consistent: if billing is monthly, talk about MRR first. If leadership wants an annualized headline, convert it cleanly and note the basis.
Annual contracts need a small extra bit of care. If your subscription mix includes both monthly and annual billing, the recognized recurring base can look different from what the invoice schedule suggests. Stripe may show both shapes cleanly, but your headline number should still reflect whether you're normalizing revenue or describing the billing cadence.
| MRR to ARR quick reference | ||
|---|---|---|
| MRR | ARR | Notes |
| $48,000 | $576,000 | simple monthly annualization |
| ARR ÷ 12 | MRR | reverse conversion for monthly reporting |
| mixed billing base | normalized ARR | document billing assumptions |
Building a Churn- and Cohort-Adjusted Run Rate
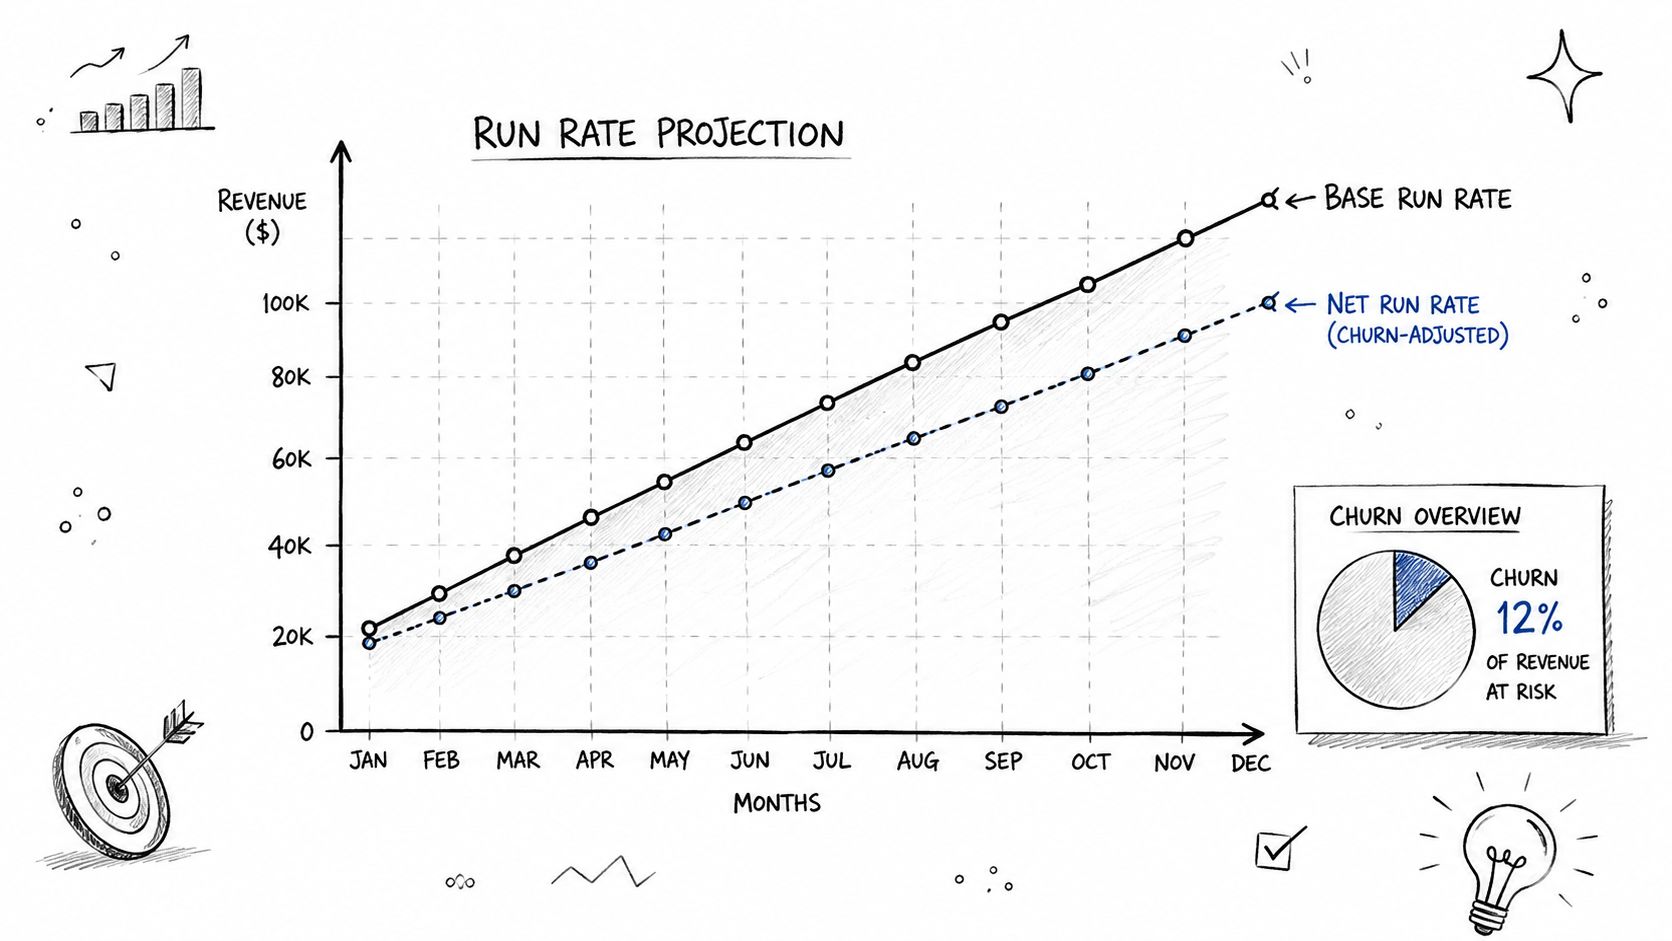
The textbook run-rate formula assumes today's base stays intact. Subscription revenue rarely behaves that neatly. If churn is eating into the base, if recent cohorts are still volatile, or if contraction is showing up in expansion-heavy accounts, then a straight annualization will overstate what's repeatable.
A more honest version starts by adjusting the base for customer loss and contraction before you project it forward. In plain terms, take the starting MRR, subtract the expected leakage, and then add the repeatable new MRR from recent cohorts. For a business with $50,000 starting MRR, 3% monthly churn, and $4,000 net new MRR, the naïve annualization would be $600,000. But once you account for churn and the fact that not all new revenue is equally durable, the repeatable figure compresses meaningfully.
Why cohort quality matters
Recent MRR is not automatically future MRR. A signup spike can make the current month look strong even if those customers haven't reached stable usage or renewal behavior yet. That's why cohort quality matters, especially in SaaS where a large part of the revenue picture comes from the retention curve, not just acquisition volume.
The cleanest way to think about this is to separate the pieces:
- Starting base, what's already live and paying.
- Leakage, churn and contraction that reduce the base.
- New revenue, only the portion that is likely to persist.
That framing makes the projection less flattering, but more useful. A board number that ignores cohort quality can drive the wrong hiring or spend decision. A cohort-adjusted number forces the question that matters, which revenue is sticky enough to count next quarter?
What not to do with the adjustment
Don't let the churn adjustment become a second guessing game with hidden assumptions. If you cannot defend the churn rate or the definition of net new MRR, the projection turns into theater. Use the same logic every month, then compare the change in the input rather than reinventing the model each time.
For a practical helper on the churn side, this churn-rate formula guide is worth keeping nearby. The habit to build is simple, never let a headline run rate stand alone when retention is shifting underneath it.
Factoring in Failed Payments, Retries, and Recovered MRR
Failed payments belong in the run-rate conversation because they change what lands in recurring revenue. In a subscription business, the gap between billed revenue and collected revenue is not just accounting noise, it's a real part of the forecast. If you ignore recovery, your run rate can look stronger than the cash and retained MRR underneath it.
A useful working model is to treat failed payments, retries, and save flows as linked steps in the same revenue path. A Stripe-flavored subscription business might see charges fail, recover part of that revenue through retry logic, and then recover more through cancellation save offers when intent is already visible. That recovered MRR should be added back to the run-rate logic only once, at the point where it becomes durable. Stripe's dunning management documentation is a helpful operational reference for teams managing that path.
Keep recovery visible and avoid double counting
The biggest mistake is counting the same dollar twice. If a failed payment is recovered through smart retries, and the same customer later enters a cancellation flow with a save offer, the reporting needs to show the final outcome once, not as two separate wins. The cleanest internal rule is that each account should have one final revenue state for the period.
A practical way to report it:
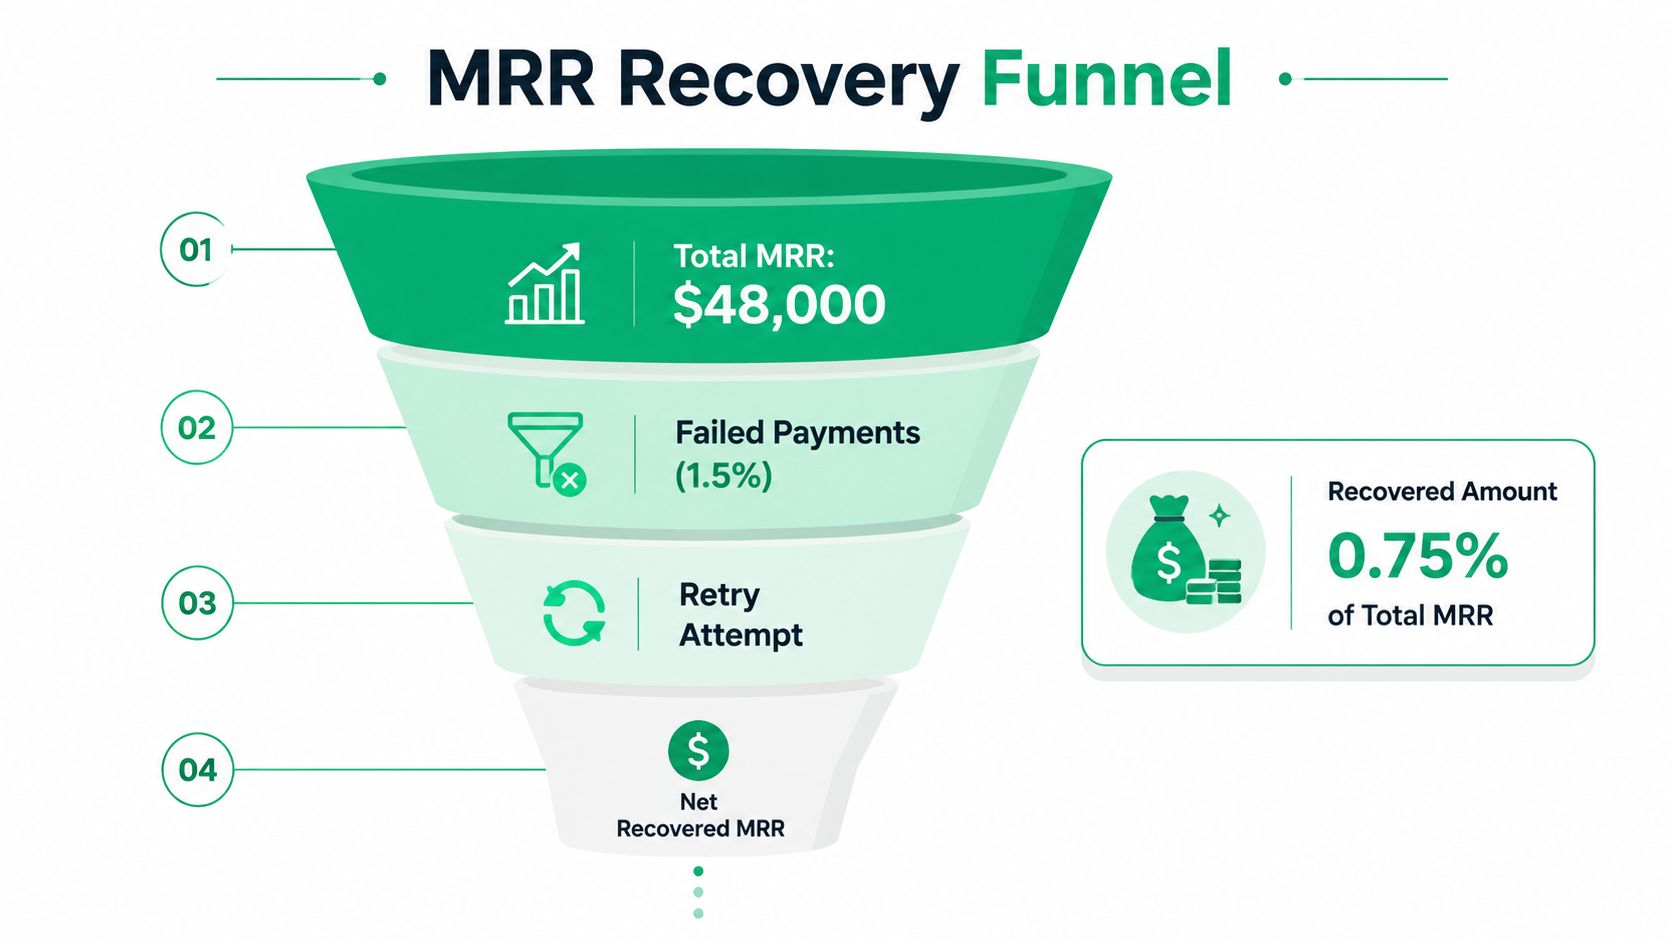
- Start with total MRR.
- Identify failed payments.
- Track retry recoveries separately from save-offer outcomes.
- Add only the net recovered MRR that remains active.
That keeps the metric honest. It also gives the team a better read on where the recovery happened, which matters when you're deciding whether billing remediation or save-path design is doing more work.
If recovery is only measured at the dashboard level, you'll know that revenue came back, but not why it came back.
Why attribution matters as much as arithmetic
RevOps and finance teams need to know whether the recovered amount came from payment retries, a plan downgrade avoidance, a temporary pause, or a direct save during cancellation. Those aren't interchangeable interventions. They have different operational costs, different failure modes, and different implications for the next forecast.
The main reason to fold recovery into run rate is simple. If a significant slice of revenue only survives because of active intervention, then the headline number should show that dependence. That doesn't make the business weaker. It makes the projection more truthful.
Putting Run Rate in Dashboards and Board Decks
A useful run rate is not one number, it's a family of views attached to different decisions. The live operations dashboard should show the freshest recurring revenue view available, usually a Stripe-linked ARR or MRR tile that updates as billing events change. Monthly business reviews need a more cautious figure, one that reflects churn, contraction, and recovery. Board decks can still lead with the headline number, but the adjustment method needs a footnote so the number doesn't float free of its assumptions.
Match the metric to the audience
Operations teams need speed. They're looking for changes in the base, so a live tile is the right place for a direct revenue snapshot. Leadership teams need comparability, so a churn-adjusted or recovery-aware view is better for trend discussion. Boards need clarity, not clutter, which means the headline number should be paired with a short note on whether it's straight annualization, MRR-to-ARR, or an adjusted projection.
That also keeps conversations honest. If the team is discussing retention, a pure run rate can distract from the actual problem. If the team is discussing traction, a heavily adjusted number can bury momentum that's real. The right view depends on the decision being made.
A simple decision rule
Use the cleanest version of the number that still answers the question in front of you.
- Traction slides, use straight annualization when the business is early and the point is momentum.
- Retention reviews, use the churn-adjusted view so leakage is visible.
- Recovery reporting, keep recovered MRR on its own line so intervention results don't disappear into the headline.
That approach gives finance, RevOps, and customer teams a shared language without flattening everything into one average. It also keeps board-facing numbers from drifting away from operational reality. When the dashboard, the monthly review, and the board deck all point to the same revenue base, the run rate stops being a vanity metric and starts behaving like a planning tool.
Common Pitfalls That Distort the Number
The fastest way to ruin a run-rate calculation is to mix incompatible inputs. Gross revenue and net revenue are not the same thing, a stale spreadsheet is not a live revenue view, and a recovered payment should not be counted twice just because it moved through two workflows. The math may still look tidy, but the output won't survive scrutiny.
The four errors that show up most often
- Mixing gross and net revenue: A team sometimes annualizes top-line billing while the board discussion is based on collected recurring revenue. Guardrail: define the revenue basis before anyone touches the formula.
- Ignoring seasonality: A peak month can make the year look stronger than it is. Guardrail: mark seasonal periods and avoid using them as the baseline without a note.
- Double-counting recovered MRR: A retry success and a save-offer success can get logged as separate wins when they reflect the same customer outcome. Guardrail: assign one final post-intervention state per account.
- Using stale data: Yesterday's spreadsheet can miss a wave of cancellations or successful recovery events. Guardrail: tie the report to a live billing source and timestamp the cut.
A run rate is only as credible as the inputs behind it.
The other failure mode is confusing booked ARR with recognized MRR. Booked revenue can look impressive on paper, but if the subscription hasn't converted into active recurring revenue yet, it shouldn't drive the same forecast. The cleanest reporting habits are usually the simplest, define the base, timestamp the period, and show any adjustment separately.
If you're building a more honest revenue view, Revcover helps subscription teams connect cancellation intent, payment recovery, and save outcomes back to the recurring revenue number. Visit Revcover to see how recovered MRR and failed-payment recovery can be tracked in the same loop, so your run rate reflects what's actually repeatable.